Marketing Dashboard External Templates
You may create your own marketing dashboard templates to be used across your campaigns, select from one of the templates below or use our built-in design templates.
To learn more about built-in design template options, and how to use dashboard templates, please review the
Marketing Dashboard Templates documentation. Below are the original report templates created by our staff to fulfill customer requests, they include report & graph content with simple designs, and are external to our platform - they must be downloaded and installed in your account by following these instructions.
Preview a Template
Click the Live Preview >>> link that's above the dashboard screenshots in this document to launch a demonstration version of a Marketing Dashboard that was created using the template. These demos allow you experience each dashboard by viewing and interacting with reports and graphs, changing dates, etc. (The password for all dashboards on this page is a demo).
Load a Dashboard Template
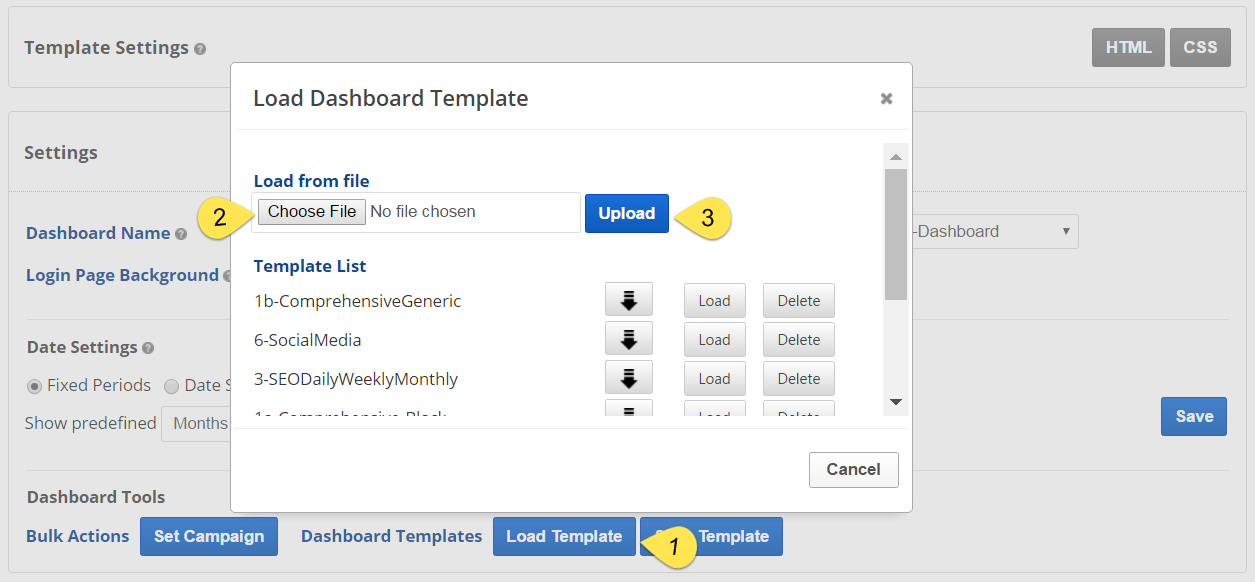
To utilize any of the dashboard templates on this page, click the download button
that displays to the right of the short description, save the file and then follow these
instructions to load the template into a campaign dashboard.
Additional reports, graphs, and pages can be added to any of the templates on this page and any unneeded reports, graphs or entire pages can easily be deleted making them good starter templates. When you've modified a template and you want to use it for other customers, simply save the template and load it on the other campaign's dashboard screen.
Support is available for Right-to-Left languages as well, contact service@rankranger.com for assistance.
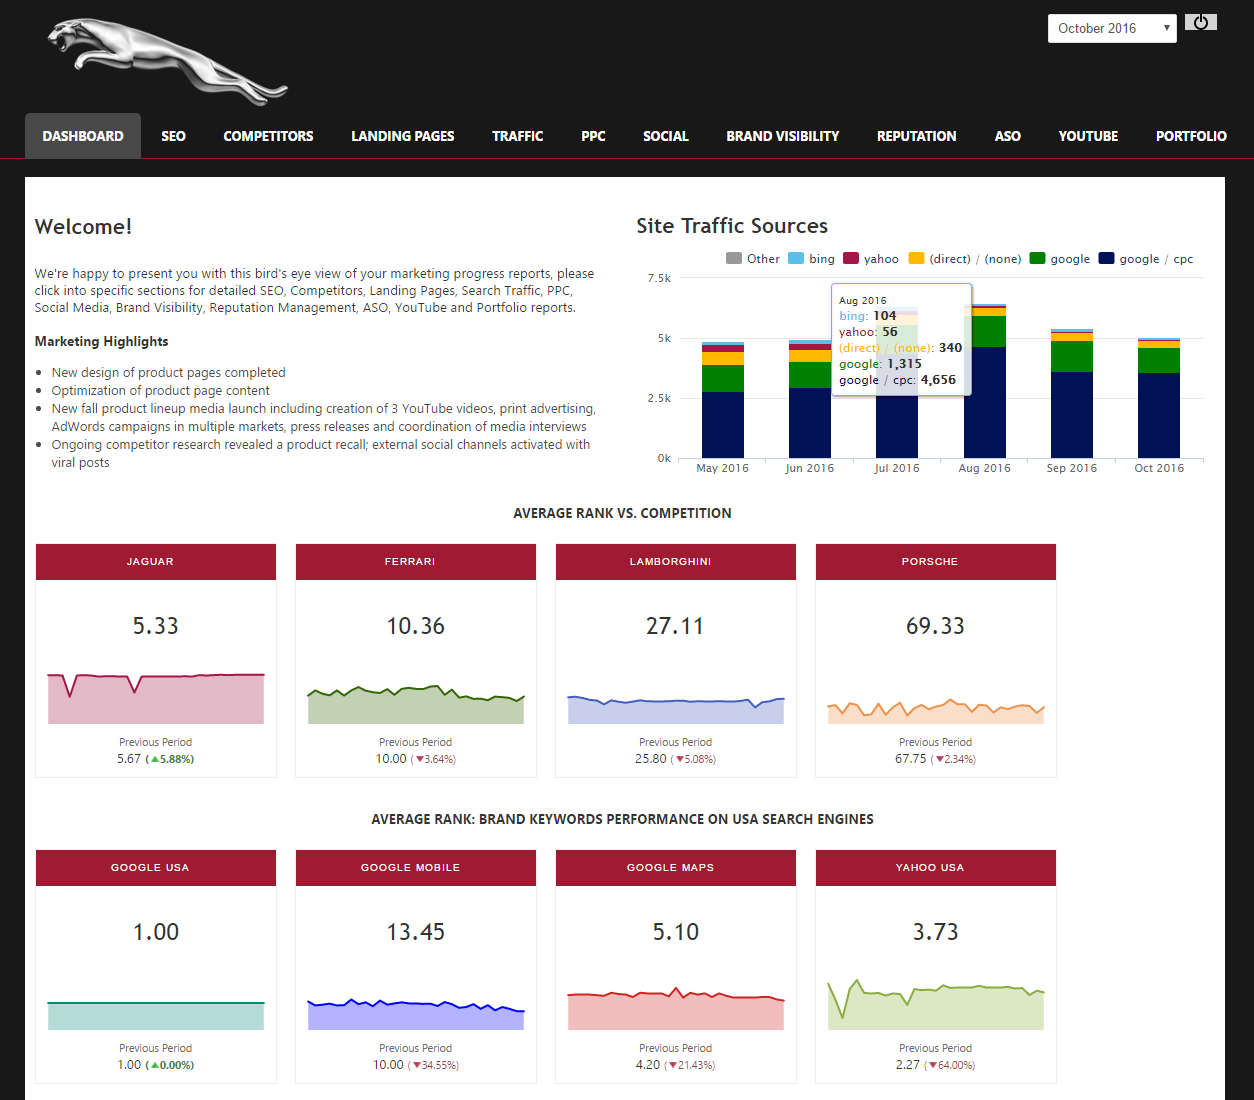
Comprehensive Marketing Dashboard
This marketing template contains a big variety of reports, graphs, and text boxes that are geared toward local businesses that have an interest in monitoring their rank, brand, search traffic, PPC performance, social analytics, and brand visibility.
Custom HTML & CSS version
Template 1a utilizes the custom HTML & CSS option that allows for code modification for brand and design match. You can change the color numbers in the CSS and the layout in the HTML (
learn more) or if you're looking for a more standard color scheme then we suggest Template 1b, a more generic option found below this one.

Generic color scheme version
Template 1b is set to the default light gray and white navigation scheme and if you would like to change that you may select any color from the palette in the CSS Scheme screen (learn more).
This template uses the Fixed Periods date setting, a white login page background, and the link to profile feature that enables the display of multiple campaigns in one Dashboard. The template contains the following reports:
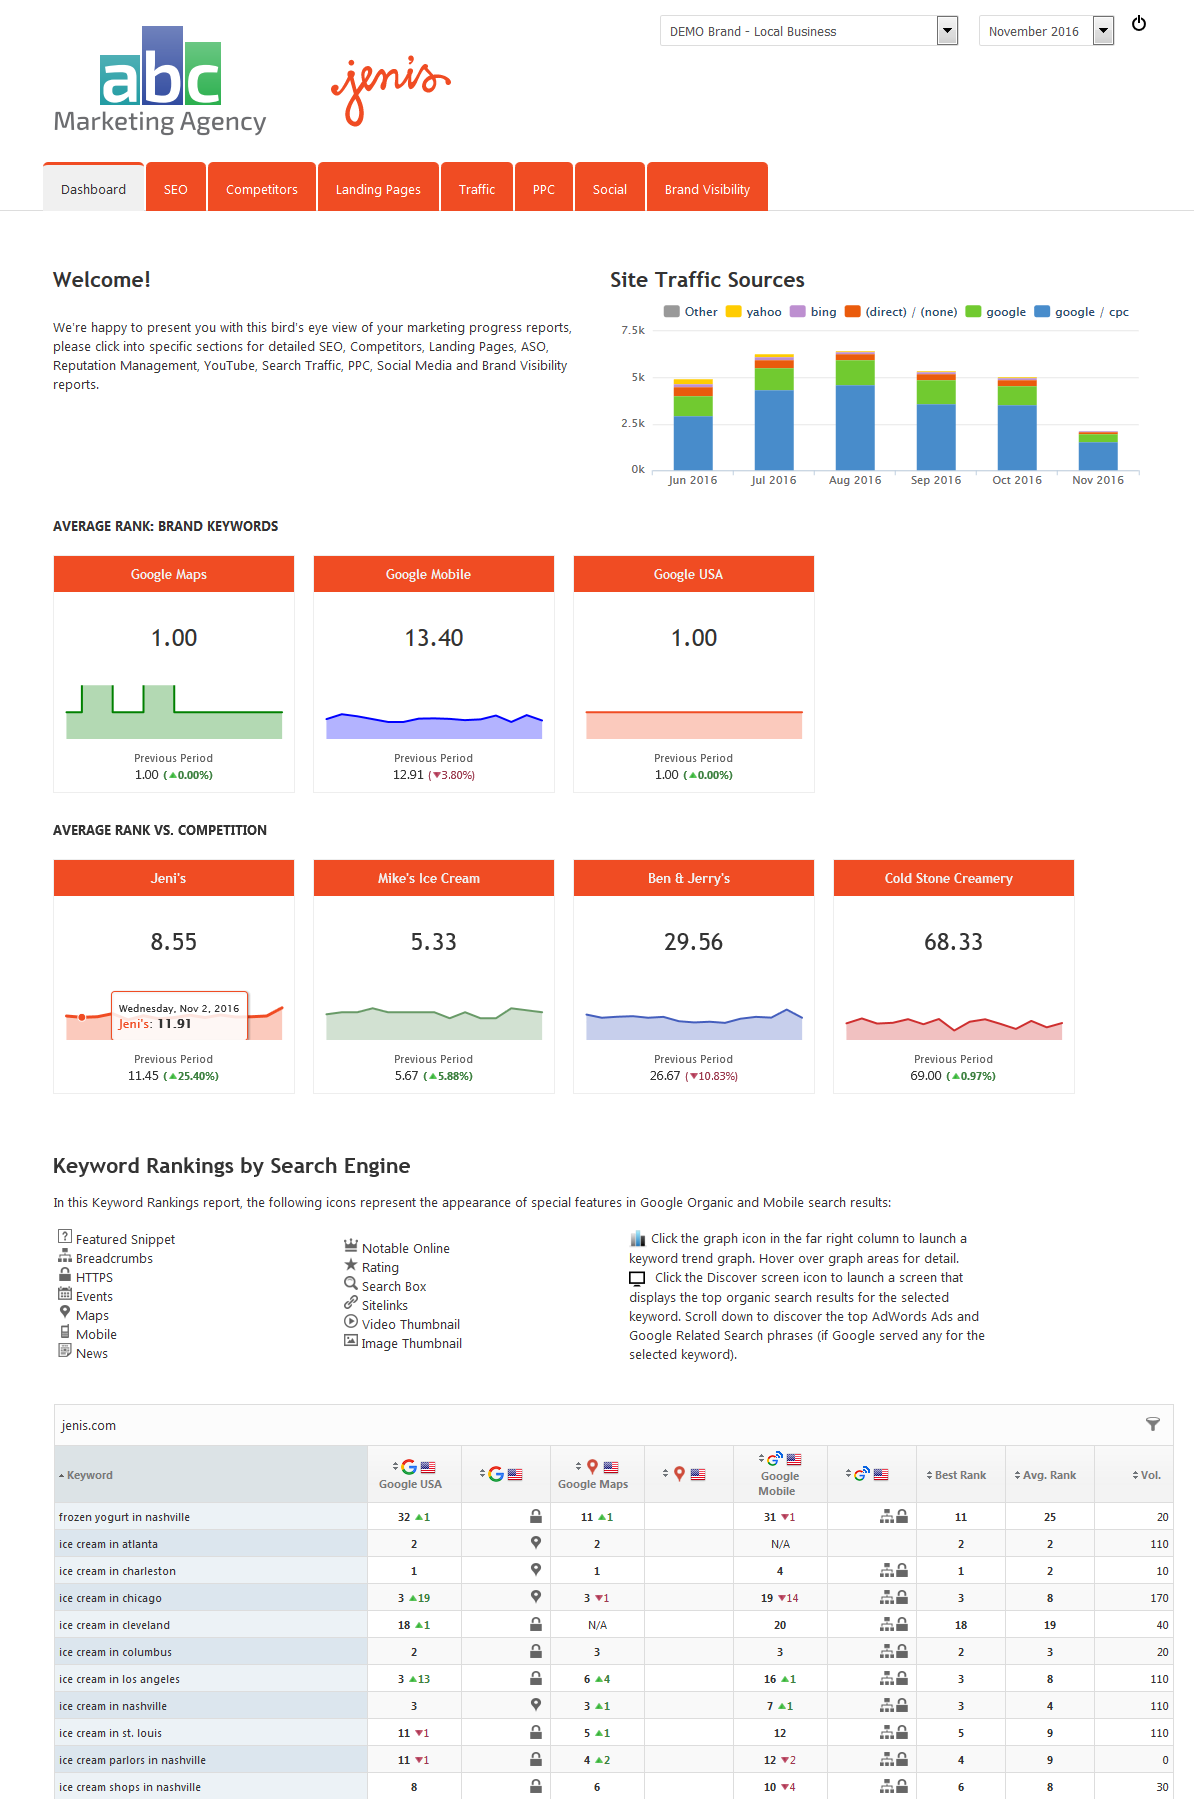
Page 1: Marketing Summary Dashboard
- Text Box | Google Analytics (Stacked Columns) displaying site traffic sources for a period of 6 months
- Single Metric Widgets: Average Rank for Brand Tag on 3 search engines and Average rank vs. 3 competitors on 1 search engine
- Text Box (with Keywords Rankings by Search Engine report icon explanation)
- Search Engines Report
Page 2: SEO Dashboard
- Text Box
- Classic Widgets: Keyword Performance
- Text Box (with keyword rank report icon explanation)
- Rank Dashboard report tracking Google USA, Google Mobile, and Google Maps. Features include SERP icons, Baseline Rank, today's Rank, Search Vol, Google+, Facebook, LinkedIn, and Pinterest shares
- Monthly Snapshot: Average Rank on Google USA, Google Mobile, and Google Maps with landing page and rank color scale enabled
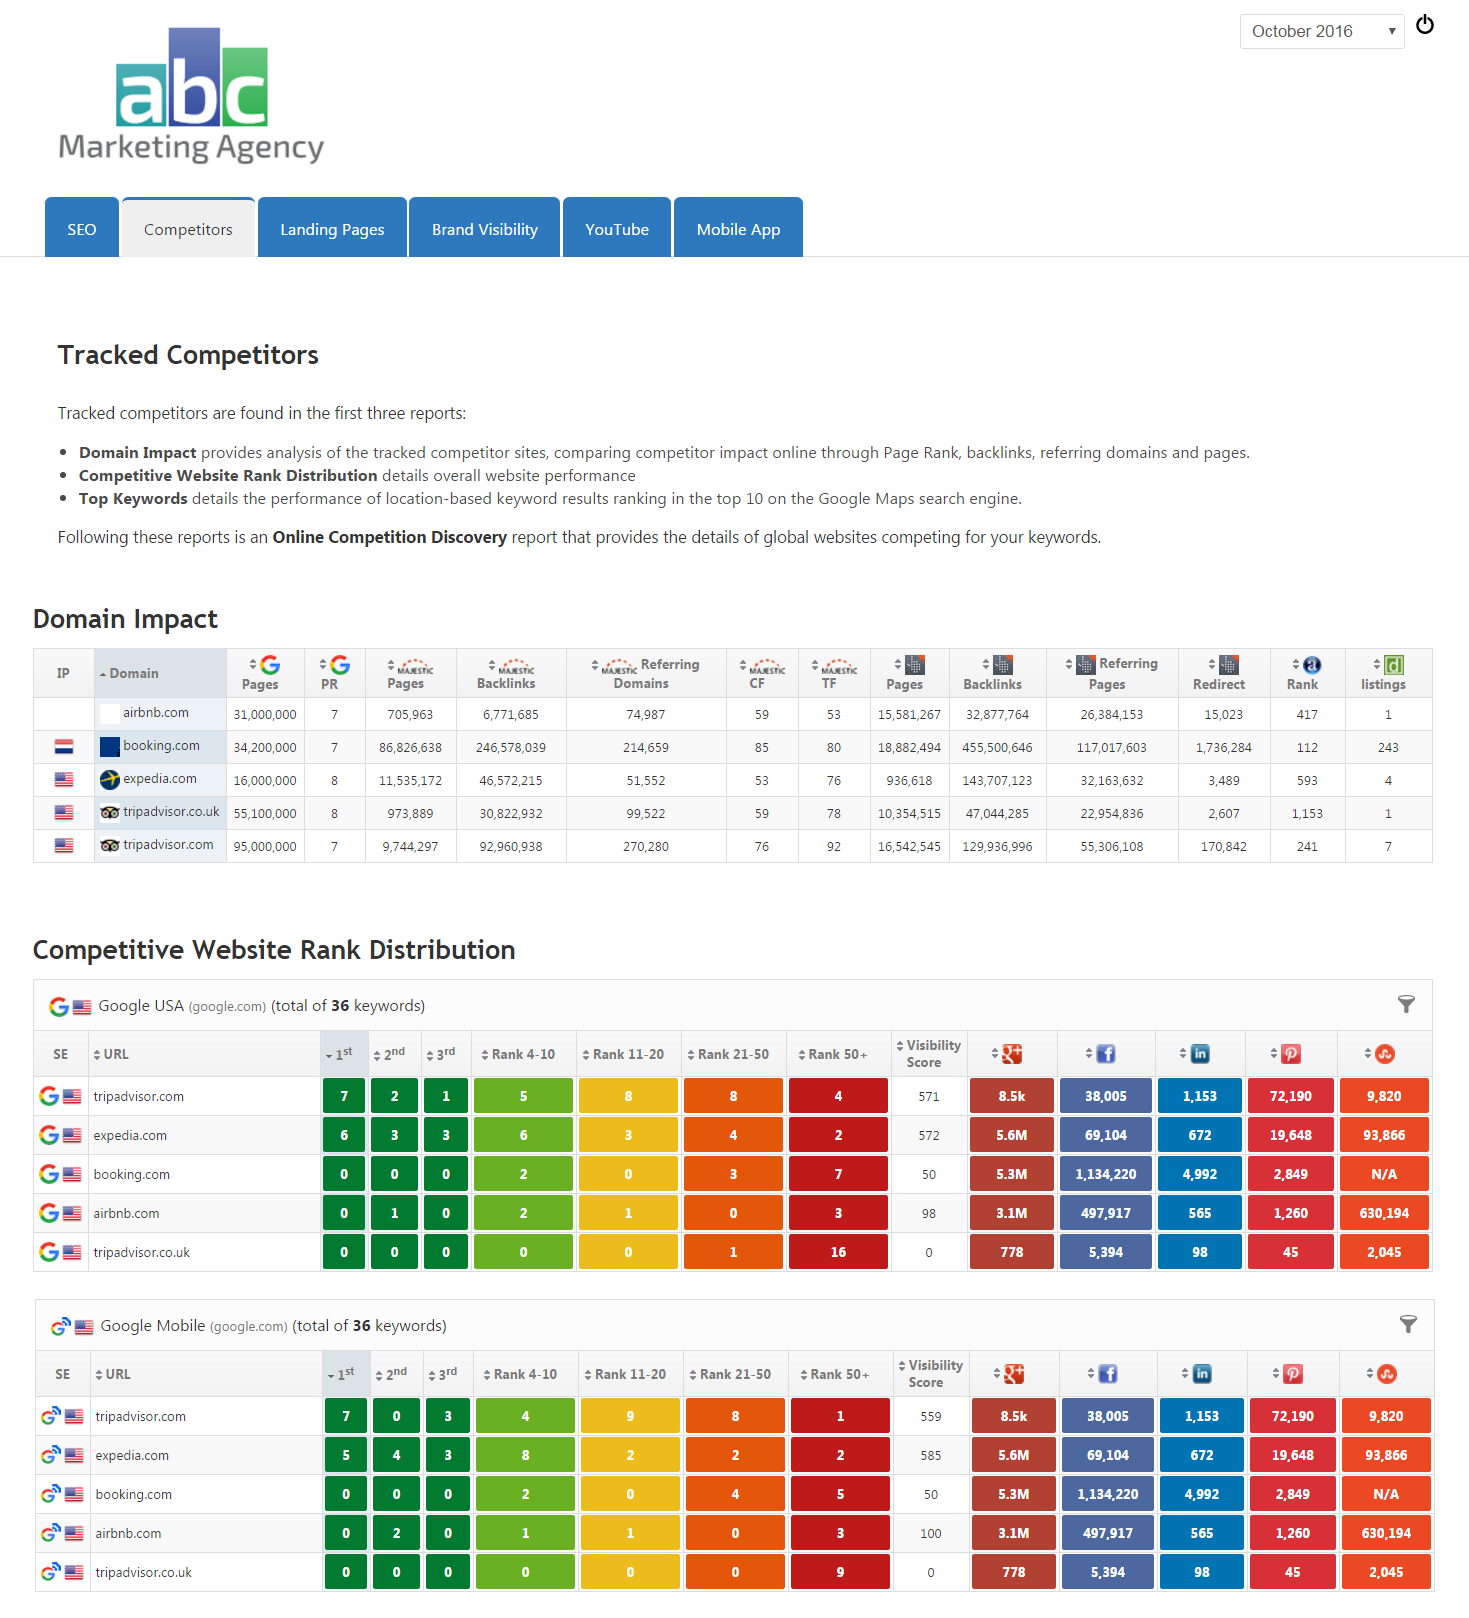
Page 3: Competitor Dashboard
- Text Box (explanation of reports on the page)
- Single Metric Widgets: Competitor Visibility Scores
- Insight Graph: Average Rank Comparison
- Domain Impact report
- Competitive Website Rank Distribution
- Rank Dashboard report: filtered for the rank of the Top 10 competitive keywords
- Text Box (explains the Top Competitors report)
- Top Organic Competitors report
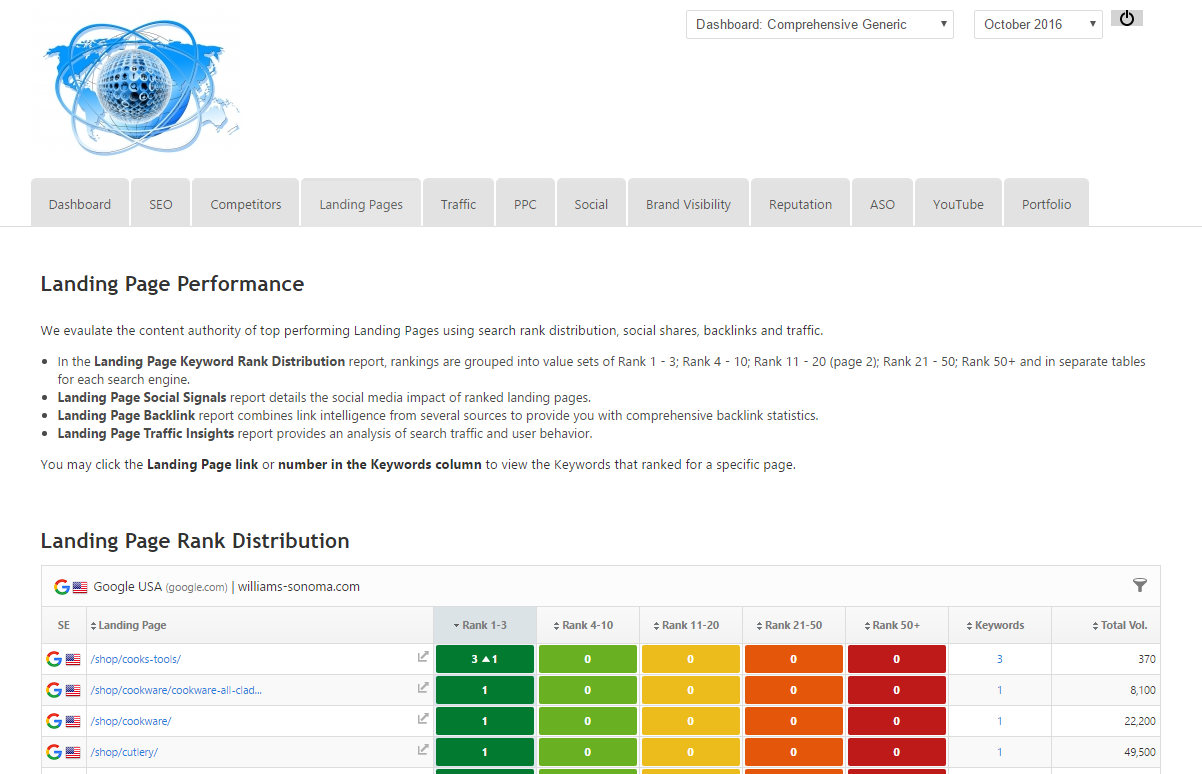
Page 4: Landing Page Dashboard
- Text Box (explanation of reports on the page)
- Landing Page Performance report: Rank distribution
- Landing Page Performance report: Social Metrics
- Landing Page Performance report: Majestic Backlink totals
- Text Box (explanation of the following report)
- Landing Page Traffic Insights report
Page 5: Search Traffic Dashboard
- Widgets: Google Analytics (Stacked Columns) Traffic Sources and New Users
- Widget: Google Analytics (Pie Chart with List) with Key Metric: Default Channel Grouping
- Widget: Google Analytics (Stacked Columns) Social Traffic
- Analytics Overview Report: displaying only the Traffic Overview section for All Goals and Sessions
- Marketing KPI report: Traffic Revenue comparison from various traffic sources
Page 6: PPC Dashboard
- Text Box introducing the PPC reports
- AdWords Campaign Performance
- AdWords Keywords Performance
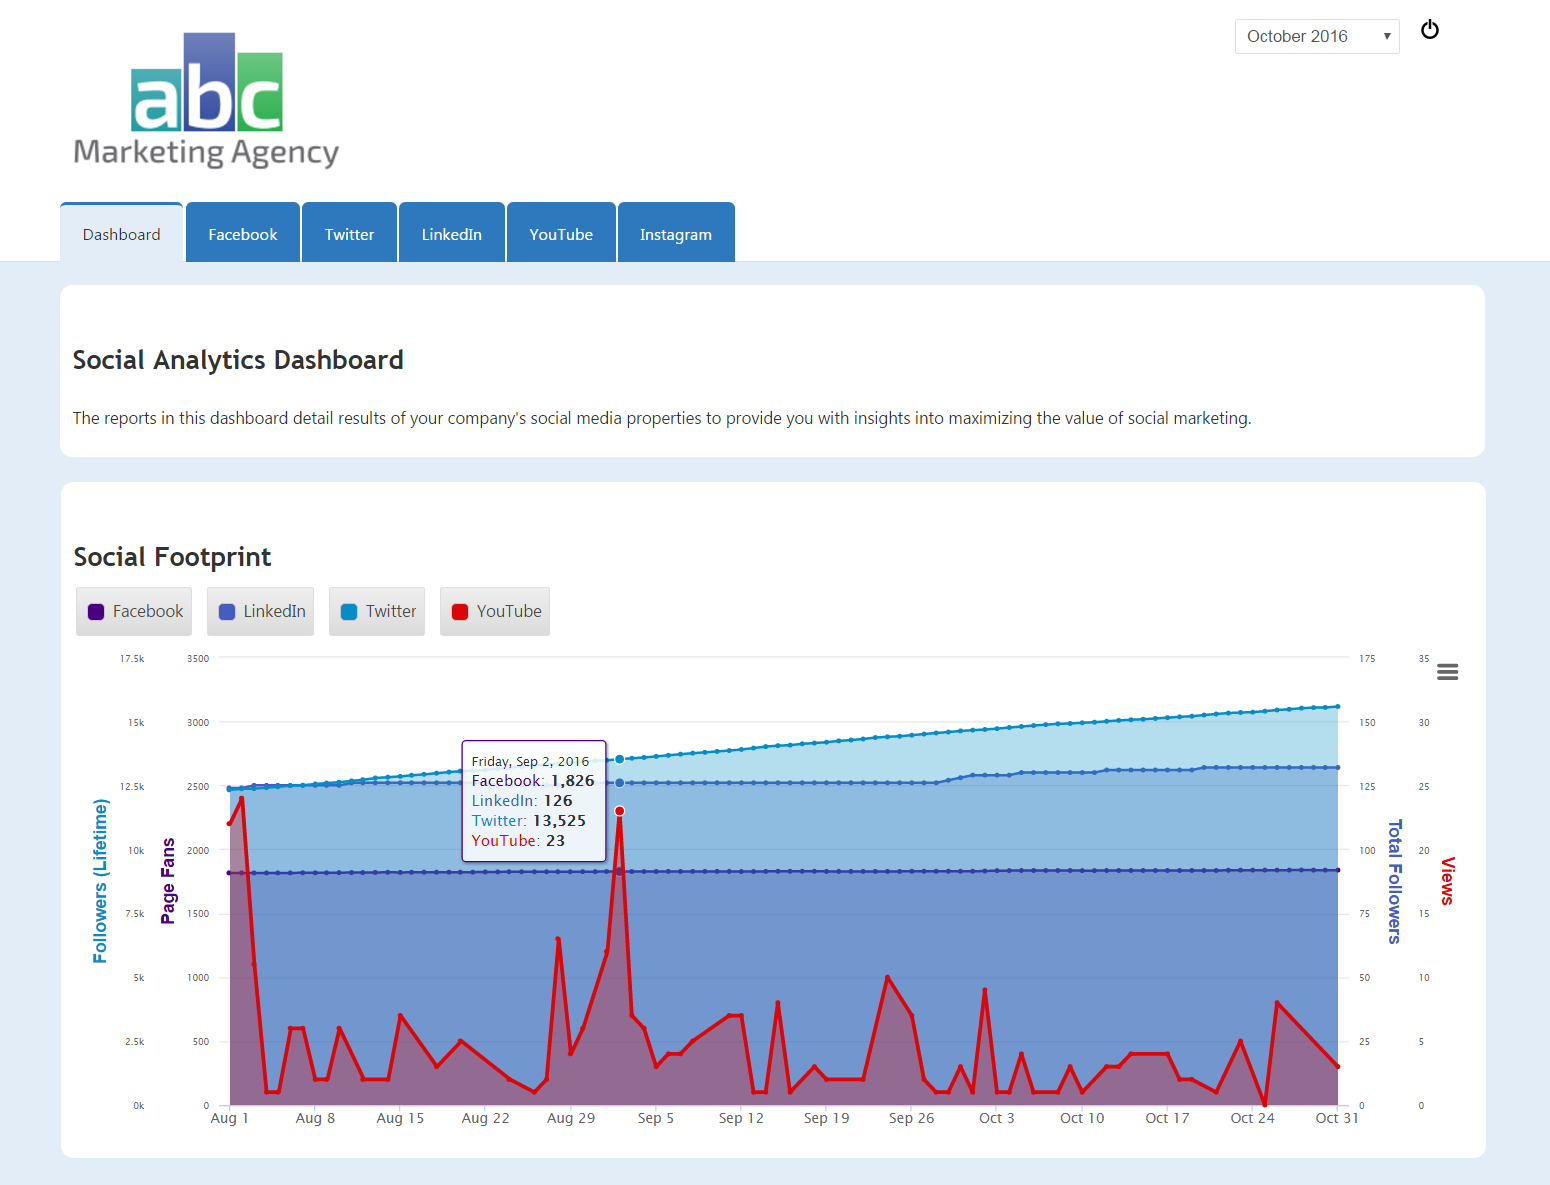
Page 7: Social Analytics Dashboard
- Text Box introducing Social Analytics reports
- Twitter
- Facebook
- LinkedIn
- YouTube
- Instagram
Page 8: Brand Visibility (Enterprise Feature)
- Text Box (detailed explanation of the report)
- Brand Visibility Report
Page 9: Reputation Management
- Text Box (detailed explanation of the reports)
- Rank Tracker Dashboard report in competitive view with brand impact turned on
- Brand Visibility report (Enterprise Feature)
Page 10: ASO
- Text Box
- Single Metric Widgets: Referring Domains, and Backlinks
- Rank Tracker Dashboard: iTunes tracking with Target URLs
- Single Metric Widgets: Referring Domains, and Backlinks
- Rank Tracker Dashboard: Google Play Store tracking Exact URLs
- Rank Tracker Dashboard: Google Play Store tracking top 10 results for primary and competitor apps
Page 11: YouTube Analytics
- Text Box
- YouTube Analytics report: Views graph
- Rank Tracker Dashboard: YouTube tracking Exact URLs with Tags displayed
- Rank Tracker Dashboard: YouTube tracking Target URLs
Page 12: Portfolio Performance (Enterprise Feature)
- Text Box
- Portfolio Performance reports broken down by industry
Local Business Brand Dashboard
Template 2 is a Local Business Brand template presenting a variety of reports and graphs that are geared toward local businesses that have an interest in monitoring their rank, brand, search traffic, PPC performance, social analytics, and brand visibility.
 Template example
Custom CSS utilizes the custom HTML & CSS option that allows for code modification for brand and design match. You can change the color numbers in the CSS and the layout in the HTML or select any color from the palette in the CSS Scheme screen (
learn more).
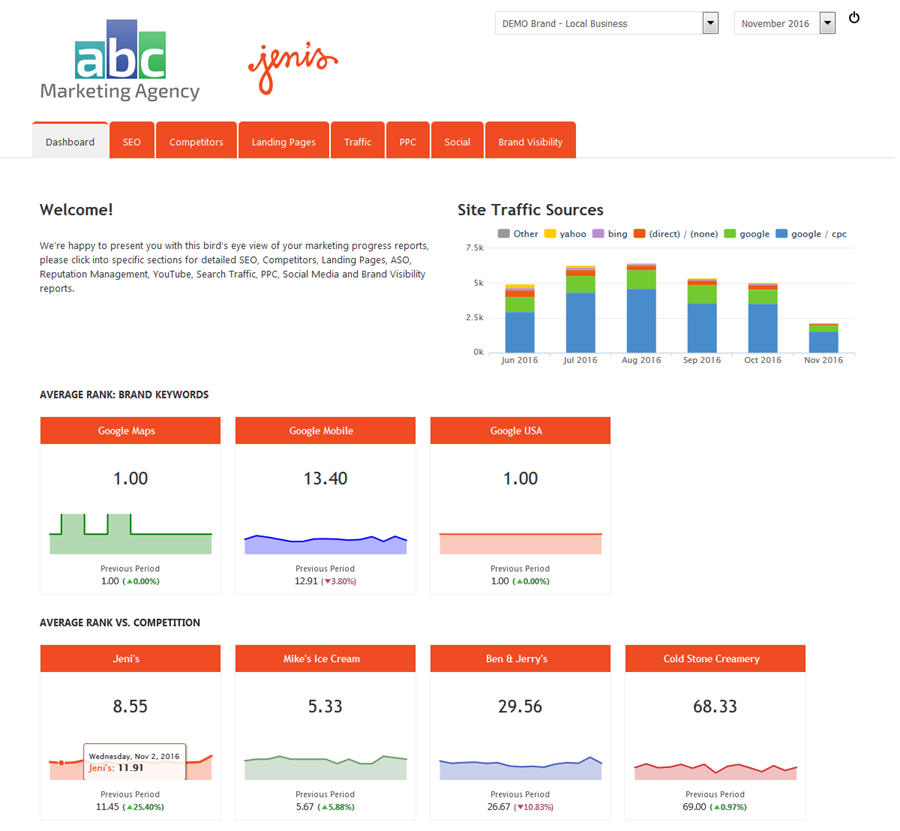
This template uses the Fixed Periods date setting, a white login page background, and the link to profile feature that enables the display of multiple campaigns in one Dashboard. The template contains the following reports:
Page 1: Marketing Summary Dashboard
- Text Box (Welcome) | Google Analytics (Stacked Columns) displaying site traffic sources for a period of 6 months
- Single Metric Widgets: Average Rank for Brand Tag on 3 search engines
- Single Metric Widgets: Today's Rank Per Location Keywords on Google Organic and Google Maps
Page 2: SEO Dashboard
- Text Box
- Classic Widgets: Keyword Performance
- Text Box (with Keyword Rankings by Search Engine report icon explanation)
- Search Engine Report
- Monthly Snapshot: Average Rank on 3 search engines with landing page and rank color scale enabled
Page 3: Competitor Dashboard
- Text Box (explanation of reports on the page)
- Insight Graph: Average Rank Comparison
- Domain Impact report
- Competitive Website Rank Distribution
- Rank Dashboard report: filtered for the rank of the Top 10 competitive keywords
- Text Box (explains the Top Competitors report)
- Top Organic Competitors report
Page 4: Landing Page Dashboard
- Text Box (explanation of reports on the page)
- Landing Page Performance report: Rank distribution
- Landing Page Performance report: Social Metrics
- Landing Page Performance report: Majestic Backlink totals
- Text Box (explanation of the following report)
- Landing Page Traffic Insights report
Page 5: Search Traffic Dashboard
- 2 side-by-side Widgets: Google Analytics (Stacked Columns) with Key Metric: New Users (Desktop & Tablet) vs. Mobile
- Widget: Google Analytics (Pie List) with Top Traffic Sessions: Medium/Source Dimension
- Audience Demographics report
- Audience Geo Location report
- Marketing KPI report: Traffic Revenue comparison from various traffic sources
Page 6: PPC Dashboard
- Text Box introducing the PPC reports
- AdWords Campaign Performance
- AdWords Keywords Performance
Page 7: Social Analytics Dashboard
- Text Box introducing Social Analytics reports
- Widget: Google Analytics (Stacked Columns): Social Traffic
- Twitter
- Facebook
- LinkedIn
- YouTube
- Instagram
Page 8: Brand Visibility (Enterprise Feature)
- Text Box (detailed explanation of the report)
- Brand Visibility Report
Daily-Weekly-Monthly Rank Dashboard
Template 3 is designed to provide a combination of daily, weekly, and monthly rank reports and graphs.
Template example
This template utilizes the custom HTML & CSS option that allows for code modification for brand and design match. You can change the colors in the CSS or you may select any color from the palette in the CSS Scheme screen (
learn more).
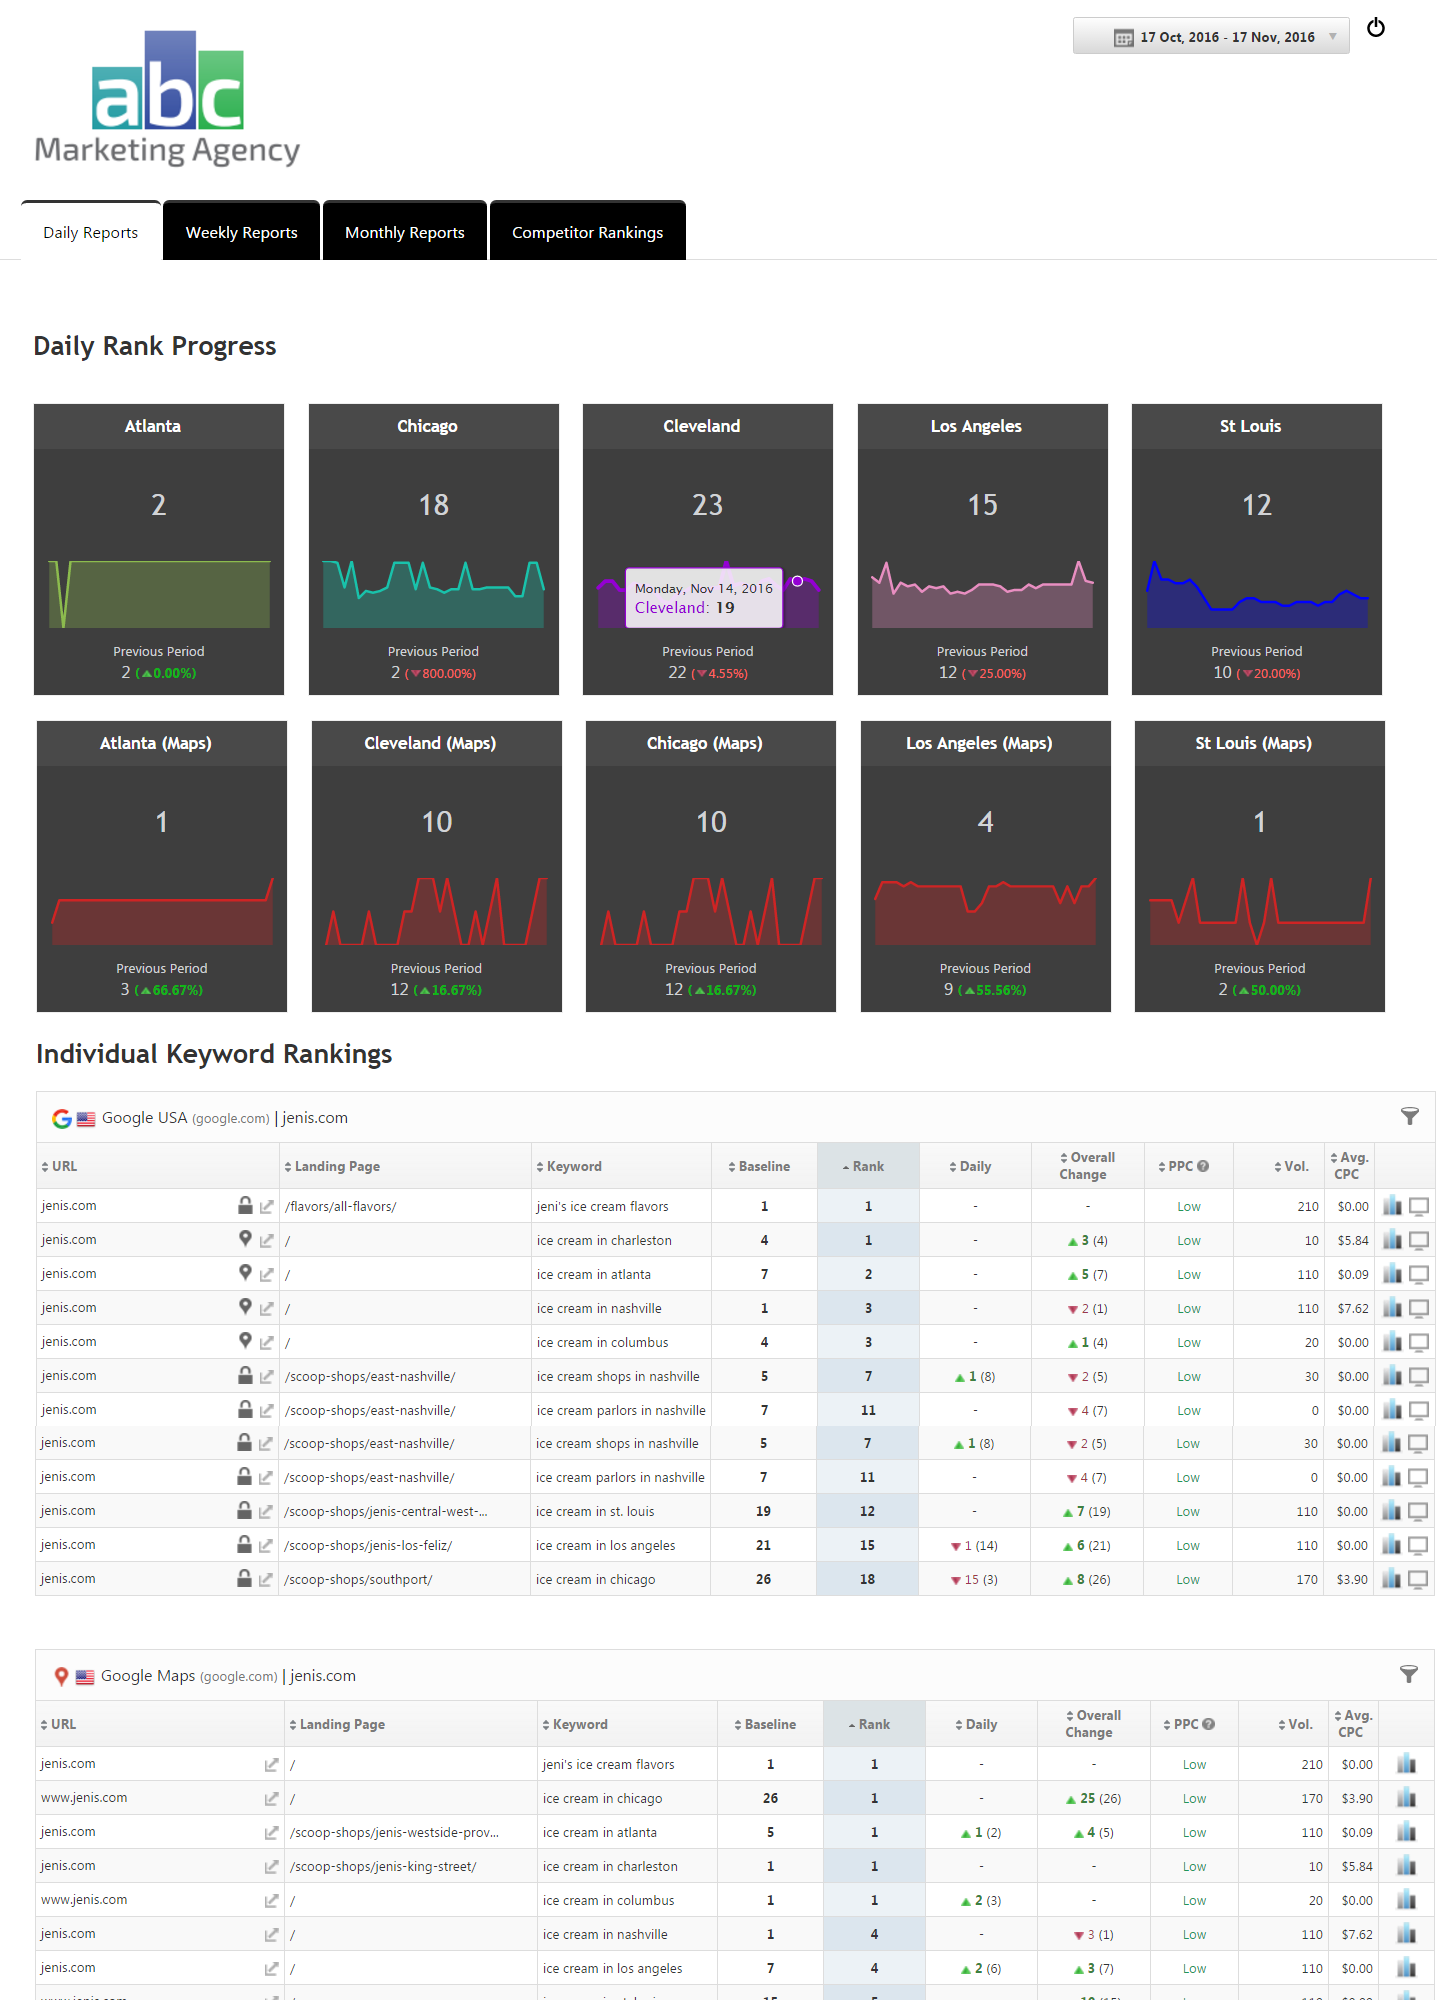
This template uses the Date Selection date setting (allowing the user to select a date range), a white login page background, and the link to profile feature that enables single sign-on for the display of multiple campaigns in one Dashboard. The template contains the following reports:
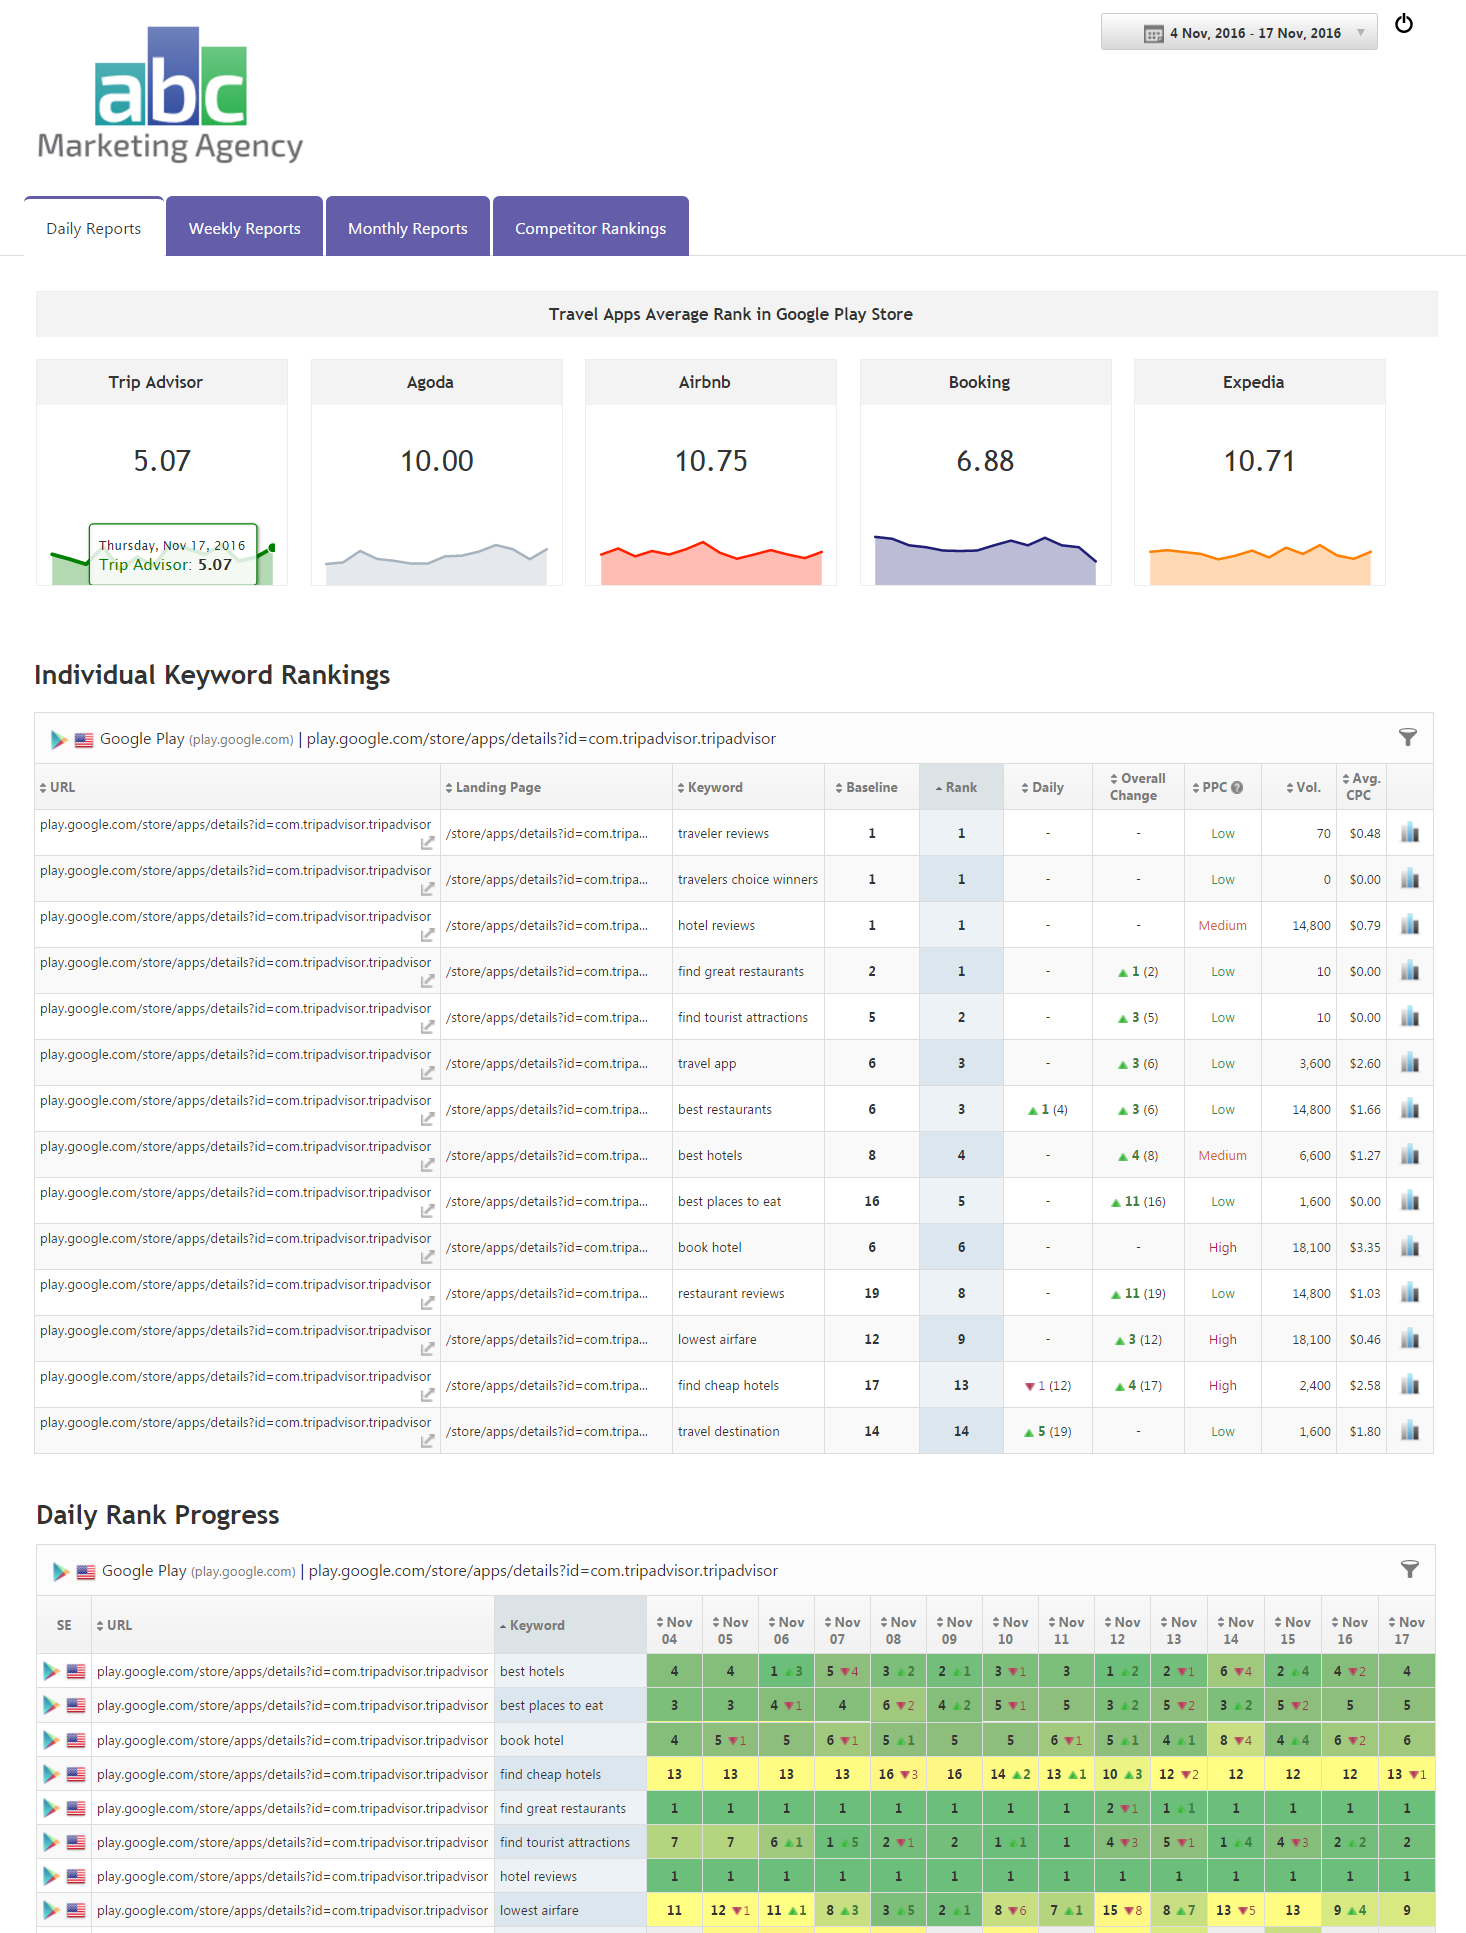
Page 1: Daily Rank Dashboard
- Single Metric Widgets: Daily Rank Progress for 5 locations presents rank on Google Organic and Google Maps
- Rank Tracker Dashboard: provides individual keyword rankings featuring landing page, baseline rank, today's rank, daily rank change, overall rank change, PPC, search volume, Aver CPC
Page 2: Weekly Rank Dashboard
- Insight Graph: primary site and 3 competitors compared on a line graph
- Classic Widgets: Keyword Performance
- Weekly Snapshot: Average Rank on all campaign search engines with landing page and rank color scale enabled
Page 3: Monthly Rank Dashboard
- Website Rank Distribution graph
- Monthly Snapshot: Average Rank with rank color scale showing rank trends for the selected date range
Page 4: Competitor Rank Dashboard
- Website Rank Distribution report
- Monthly Snapshot: Average Rank per keyword for each competitor vs. the primary domain tracked
SEO, Traffic, Social, Embed Video Dashboard
Template 4 includes reports and graphs for SEO, competitor rank, landing page performance, search traffic, social analytics, and a page that's ready for a video to be embedded.
Template example
This template is set to the teal navigation scheme and if you would like to change that you may select any color from the palette in the CSS Scheme screen or edit the CSS code (
learn more).
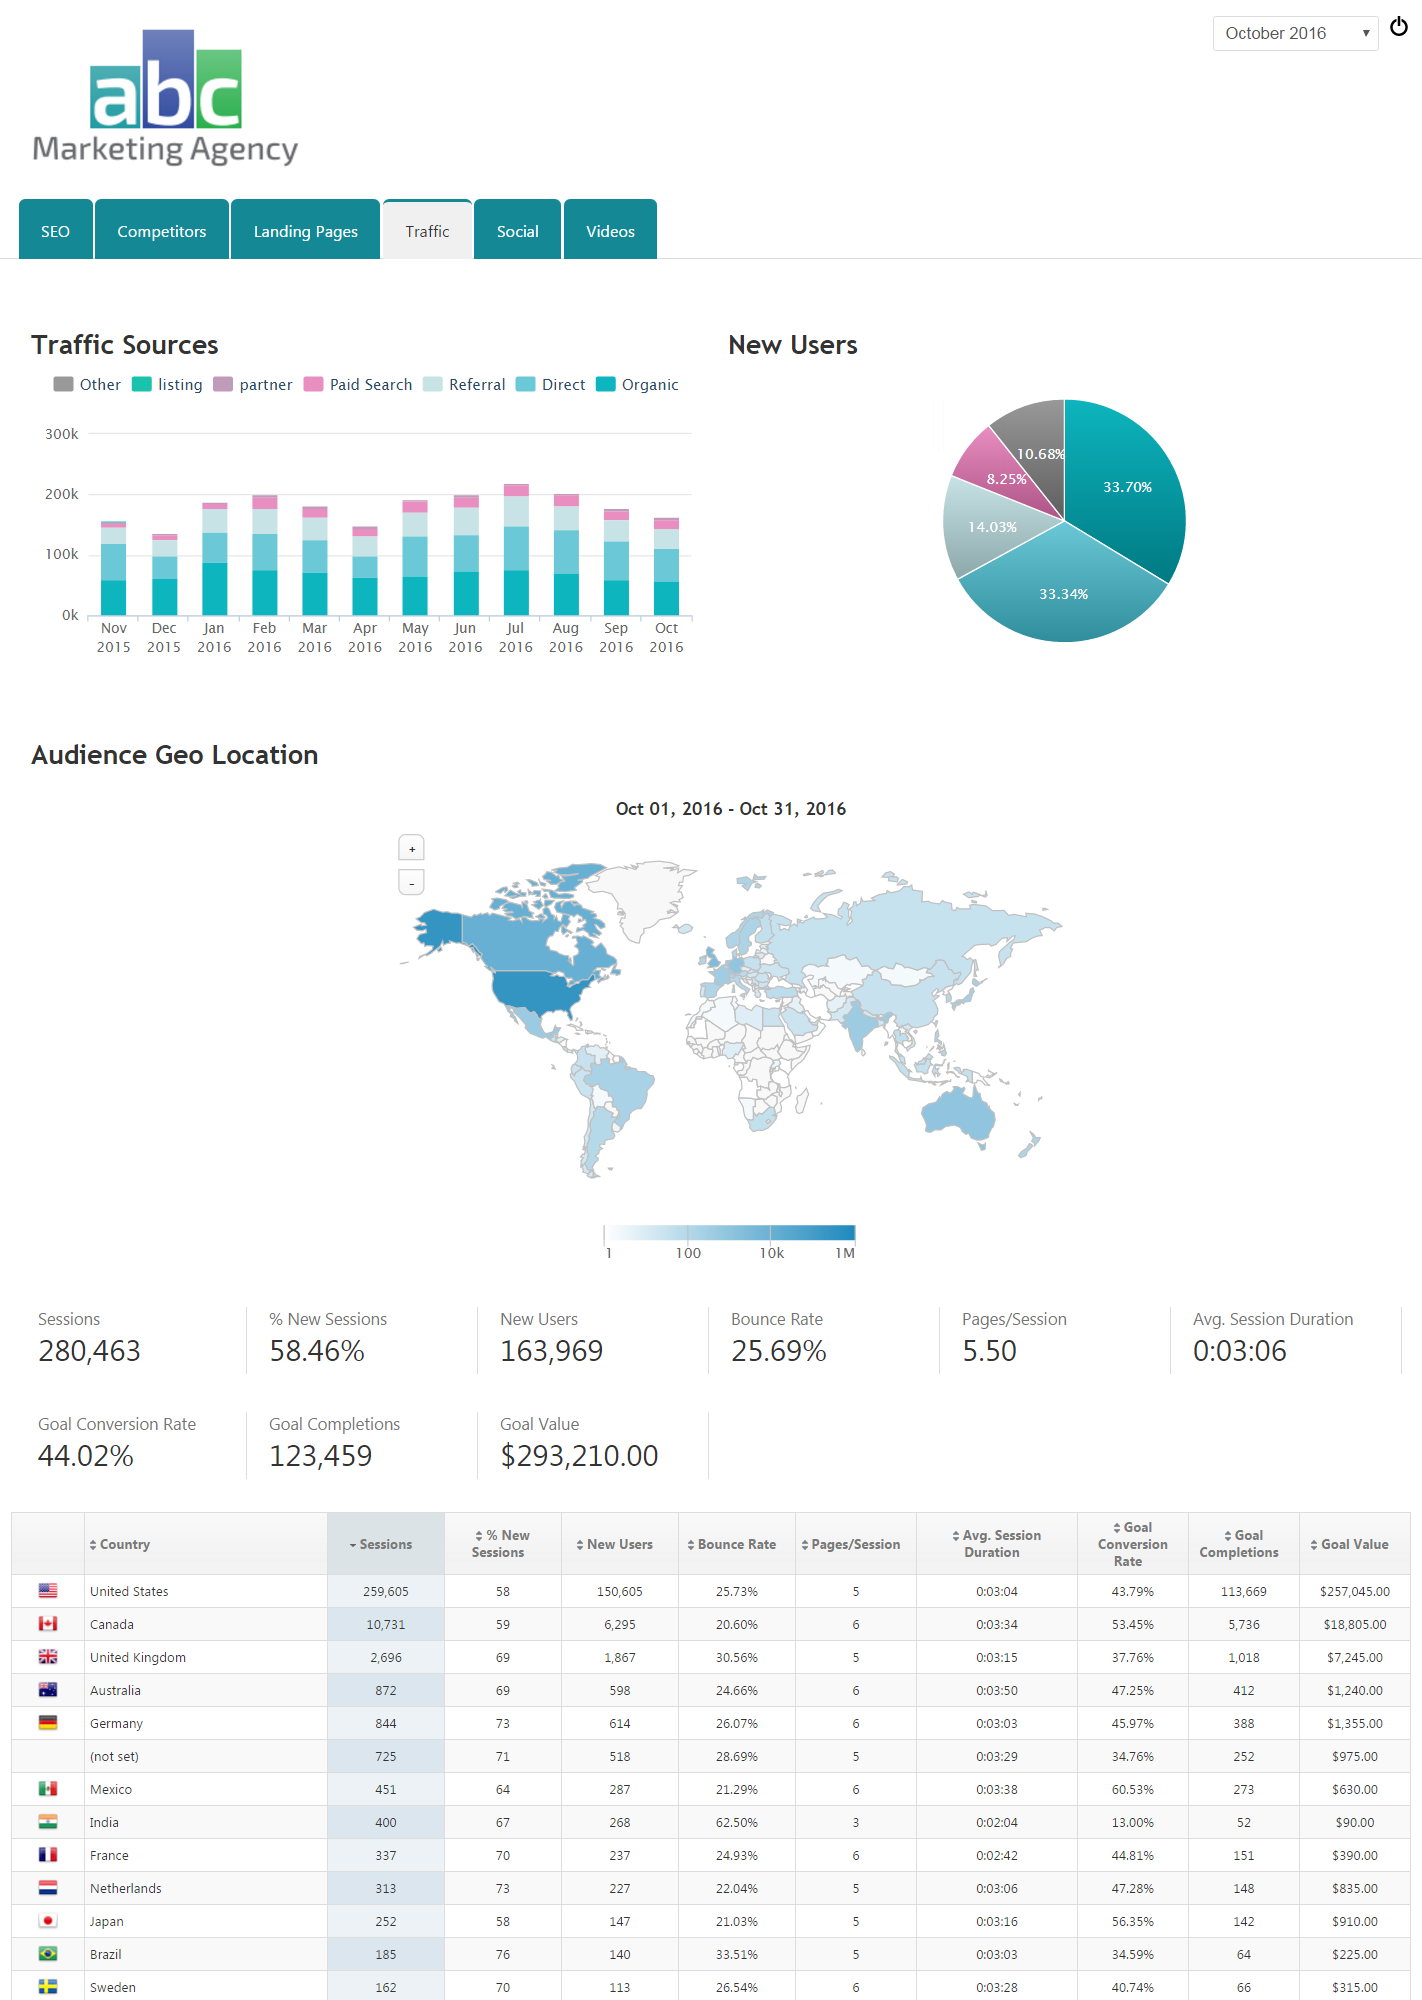
This template uses the Fixed Periods date setting, a white login page background, and the link to profile feature that enables the display of multiple campaigns in one Dashboard. The template contains the following reports:
Page 1: SEO Dashboard
- Text Box
- Classic Widgets: Keyword Performance
- Text Box (with report icon explanation)
- Search Engines report
- Rank Dashboard report tracking Google USA, Google Mobile, and Google Maps. Features include SERP icons, Baseline Rank, today's Rank, Search Vol, Google+, Facebook, LinkedIn, and Pinterest shares
- Monthly Snapshot: Average Rank on Google USA, Google Mobile, and Google Maps with landing page and rank color scale enabled
Page 2: Competitor Dashboard
- Text Box (explanation of reports on the page)
- Domain Impact report
- Website Rank Distribution
- Text Box (explains the Top Competitors report)
- Top Organic Competitors report
- Rank Dashboard report: filtered for the rank of the Top 10 competitive keywords
Page 3: Landing Page Dashboard
- Text Box (explanation of reports on the page)
- Landing Page Performance report: Rank distribution
- Landing Page Performance report: Social Metrics
- Landing Page Performance report: Majestic Backlink totals
Page 4: Search Traffic Dashboard
- Widgets: Google Analytics (Stacked Columns) with Key Metric: Traffic Sources & Google Analytics (Pie) with New Users
- Audience Geo Location report
- Analytics Overview Report: displaying only the Traffic Overview section for All Goals and Sessions
- Marketing KPI report: Traffic Revenue comparison from various traffic sources
Page 5: Social Analytics Dashboard
- Text Box introducing Social Analytics reports
- Twitter
- Facebook
- LinkedIn
- YouTube
- Instagram
Page 6: Videos
- Text Box with Video embed code that can be replaced with the code from any YouTube or Vimeo video
- Text Box with Video embed code that can be replaced with the code from any YouTube or Vimeo video
SEO, Brand, YouTube, ASO Dashboard
Template 5 contains a variety of reports and graphs for SEO, Competitor Rank, Landing Page performance, Brand Visibility, YouTube Channel performance and rank, and ASO Mobile App rank performance.
Template example
This template is set to the built-in blue and white navigation scheme and if you would like to change that you may select any color from the palette in the CSS Scheme screen or edit the CSS code (
learn more).
This template uses the Fixed Periods date setting, a default
login page background feature and contains the following reports:
Page 1: SEO Dashboard
- Text Box (Welcome)
- Class Widgets: Keyword Performance
- Text Box (with Keywords Rankings by Search Engine report icon explanation)
- Search Engines Report
- Rank Dashboard report with SERP icons, Baseline Rank, today's Rank, Monthly Rank Change, Overall Rank Change, Search Volume, Google+, Facebook, LinkedIn, Pinterest, and StumbleUpon columns displayed.
- Monthly Snapshot report with landing page and rank color scale enabled and set for Average Rank.
Page 2: Competitor Dashboard
- Text Box (explanation of reports on the page)
- Domain Impact report
- Website Rank Distribution
- Text Box (explains the Top Competitors report)
- Top Organic Competitors report
Page 3: Landing Page Performance Dashboard
- Text Box (explanation of reports on the page)
- Landing Page Performance report: Rank distribution
- Landing Page Performance report: Social Metrics
- Landing Page Performance report: Majestic Backlink totals
Page 4: Brand Visibility (Enterprise Feature)
- Text Box (detailed explanation of the report)
- Brand Visibility Report
Page 5: YouTube Channel Performance
- Text Box with Video embed code that can be replaced with the code from any YouTube or Vimeo video
- YouTube Social Analytics graphs
- Rank Dashboard report displaying Best Rank, Today's Rank, Social Shares, and Targeted URL columns
Page 6: ASO Tracking of Mobile Apps
- Classic Widgets: Keyword Performance
- Monthly Rank Snapshot report with rank color scale feature enabled and set to Average Rank.
- Rank Tracker Dashboard report displaying Top 50 Rank with competitor comparison per ranked keyword.
Social Media Channel Dashboard
Template 6 contains a Social Analytics Dashboard with separate pages for Facebook, Twitter, LinkedIn, YouTube, and Instagram reports and graphs.
Template example
A blue color scheme and light blue page background were applied to this dashboard and can be modified by selecting a standard color scheme.
This template uses the Fixed Periods date setting and a white login page background. Pages can be re-ordered or removed as needed. The template contains the following reports:
Page 1: Social Analytics Dashboard
- Text Box that can be edited to contain your custom message.
- Insight Graph highlighting Facebook, LinkedIn, Twitter, and YouTube social metrics.
Page 2: Facebook Analytics Dashboard
- Facebook Strategy Text Box that can be edited to contain your custom message.
- Facebook Page Analytics: Page Stories, Performance, Engagement, People Talking About This, Net Likes, Total Reach, and Likes, Comments, and Shares displayed in colorful graphs, followed by an External Referrers pie chart and Video Views graph.
- Facebook Post Performance: Total Impressions, Post Impressions, and Post Performance.
- Facebook Audience Analytics: Age, Gender, Fans by Country, Fans by City, Fans by Language
Facebook Ads account and campaign reports are also available and can easily be added to this page (or a new page).
Page 3: Twitter Analytics Dashboard
- Twitter Strategy Text Box that can be edited to contain your custom message.
- Twitter Analytics: Followers, Lifetime Totals, Account Performance, Mentions Performance, Post & Mentions graph, and Engagements Organic Trends graphs.
- Twitter Audience Demographics: Followers Popularity, Top Influencers Breakdown, GEO Location, Followers by Language, and Followers Hashtags.
Page 4: LinkedIn Analytics Dashboard
- LinkedIn Strategy Text Box that can be edited to contain your custom message.
- LinkedIn Analytics: Select a metric graph, Followers summary, GEO location, Company Size, Seniority, Industry, Function, and Reach graphs and charts followed by Recent Updates post statistics.
Page 5: YouTube Analytics Dashboard
- YouTube Strategy Text Box that can be edited to contain your custom message.
- YouTube Channel Analytics: Top 10 Videos, Audience Demographics, and Discovery of Top Playback Locations and Traffic Sources.
Page 6: Instagram Analytics Dashboard
- Instagram Strategy Text Box that can be edited to contain your custom message.
- Instagram Followers graph
App Store Rank Tracking Dashboard
Template 7 is designed to provide a combination of daily, weekly, and monthly rank reports and graphs for tracking apps in Google Play Store or Apple iTunes search results.
Template example
This template is set to the purple and white navigation scheme and if you would like to change that you may select any color from the palette in the CSS Scheme screen or edit the CSS code. (
learn more).
This template uses the Date Selection date setting (allowing the user to select a date range), a white login page background, and the link to profile feature that enables single sign-on for the display of multiple campaigns in one Dashboard. The template contains the following reports:
Page 1: Daily Rank Dashboard
- Single Metric Widgets: Daily Rank for the primary app and 4 competitors
- Rank Tracker Dashboard: provides individual keyword rankings featuring landing page, baseline rank, today's rank, daily rank change, overall rank change, PPC, search volume, Average CPC
- Daily Snapshot report
Page 2: Weekly Rank Dashboard
- Insight Graph: primary site and 4 competitors compared on a line graph
- Classic Widgets: Keyword Performance
- Weekly Snapshot: Average Rank on all campaign search engines with landing page and rank color scale enabled
Page 3: Monthly Rank Dashboard
- Website Rank Distribution graph
- Monthly Snapshot: Average Rank with rank color scale showing rank trends for the selected date range
Page 4: Competitor Rank Dashboard
- Rank Distribution report
- Monthly Snapshot: Average Rank per keyword for each competitor vs. the primary domain tracked
Template 9 provides a combination of rank, traffic, and backlinks metric widgets, graphs, and comparison tables.
Template example
This template is set to the default color scheme and if you would like to change that you may select any color from the palette in the CSS Scheme screen or edit the CSS code. (
learn more).
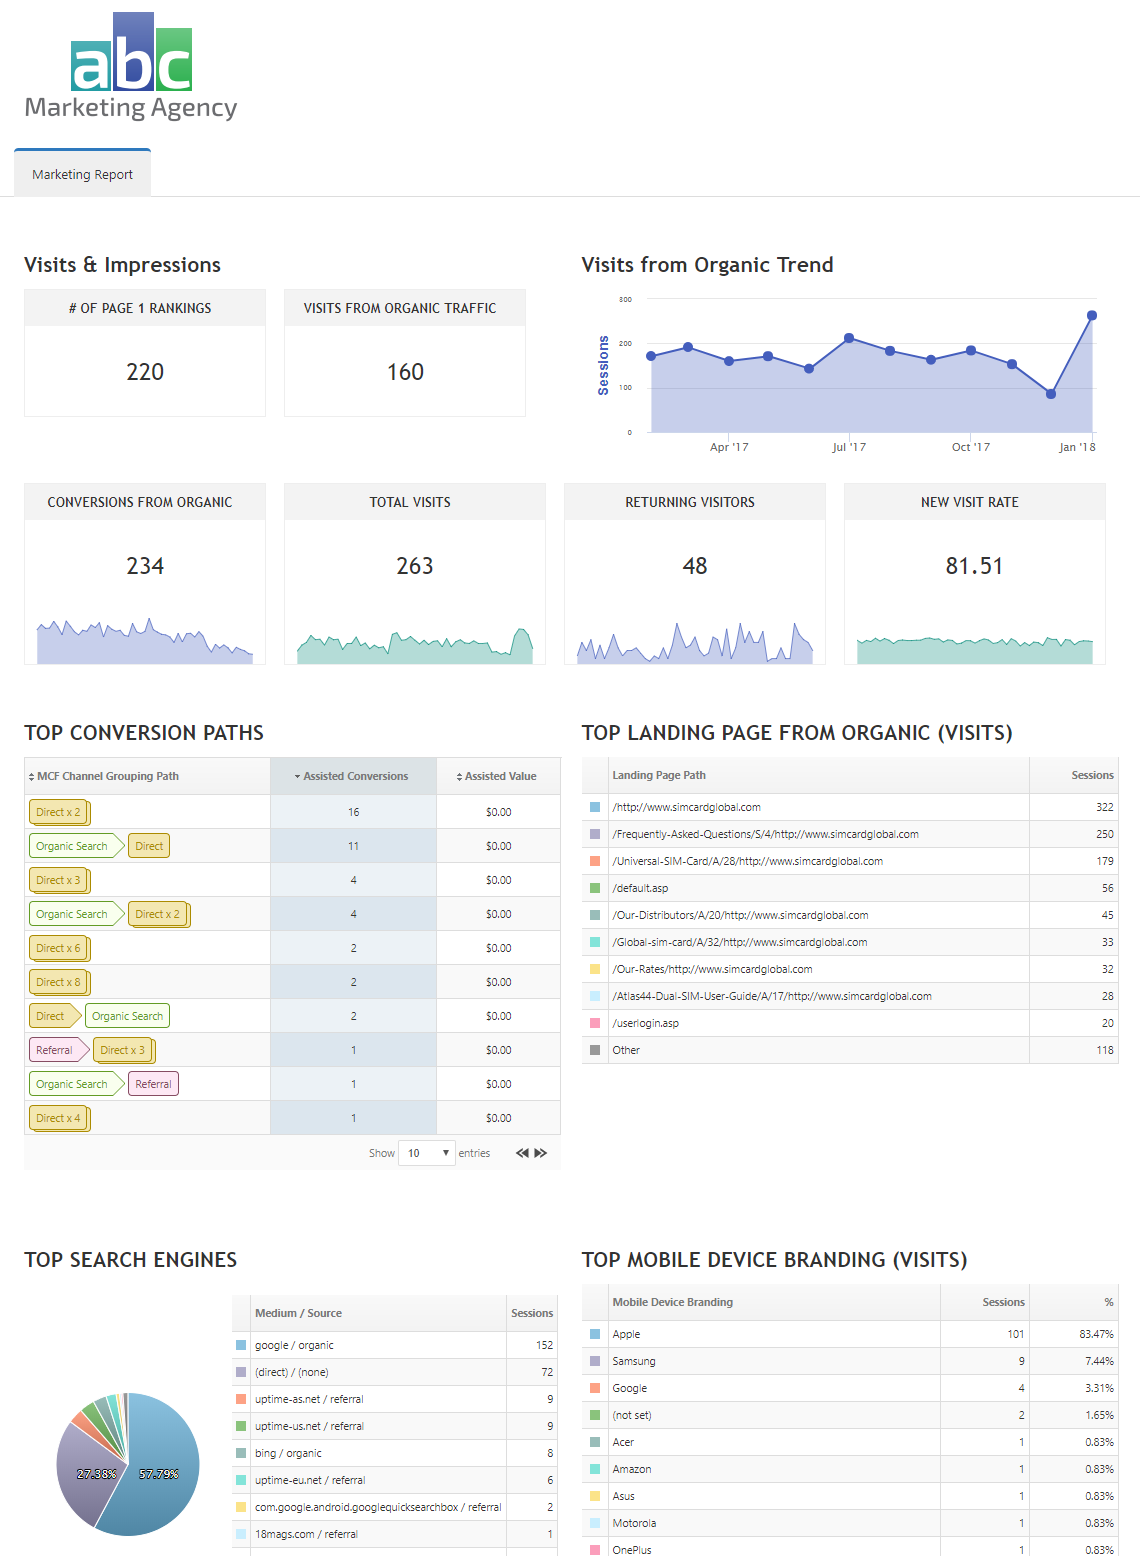
This template uses the Fixed Date setting. This Single Page Dashboard template contains the following reports:
- Single Metric Widgets
- Top Conversion Paths / Multi-Channel Funnel Groups
- Google Analytics Pie/List Widgets
- Insight Graph using rank distribution metrics
- Search Engines report
- Single Metric Widgets
- Link Manager report
Google Analytics Widget Dashboard
Template 10 contains a variety of customizable traffic widgets, providing a white label solution for Google Analytics metrics.
Template example
This template is set to the default color scheme and if you would like to change that you may select any color from the palette in the CSS Scheme screen or edit the CSS code. (
learn more).
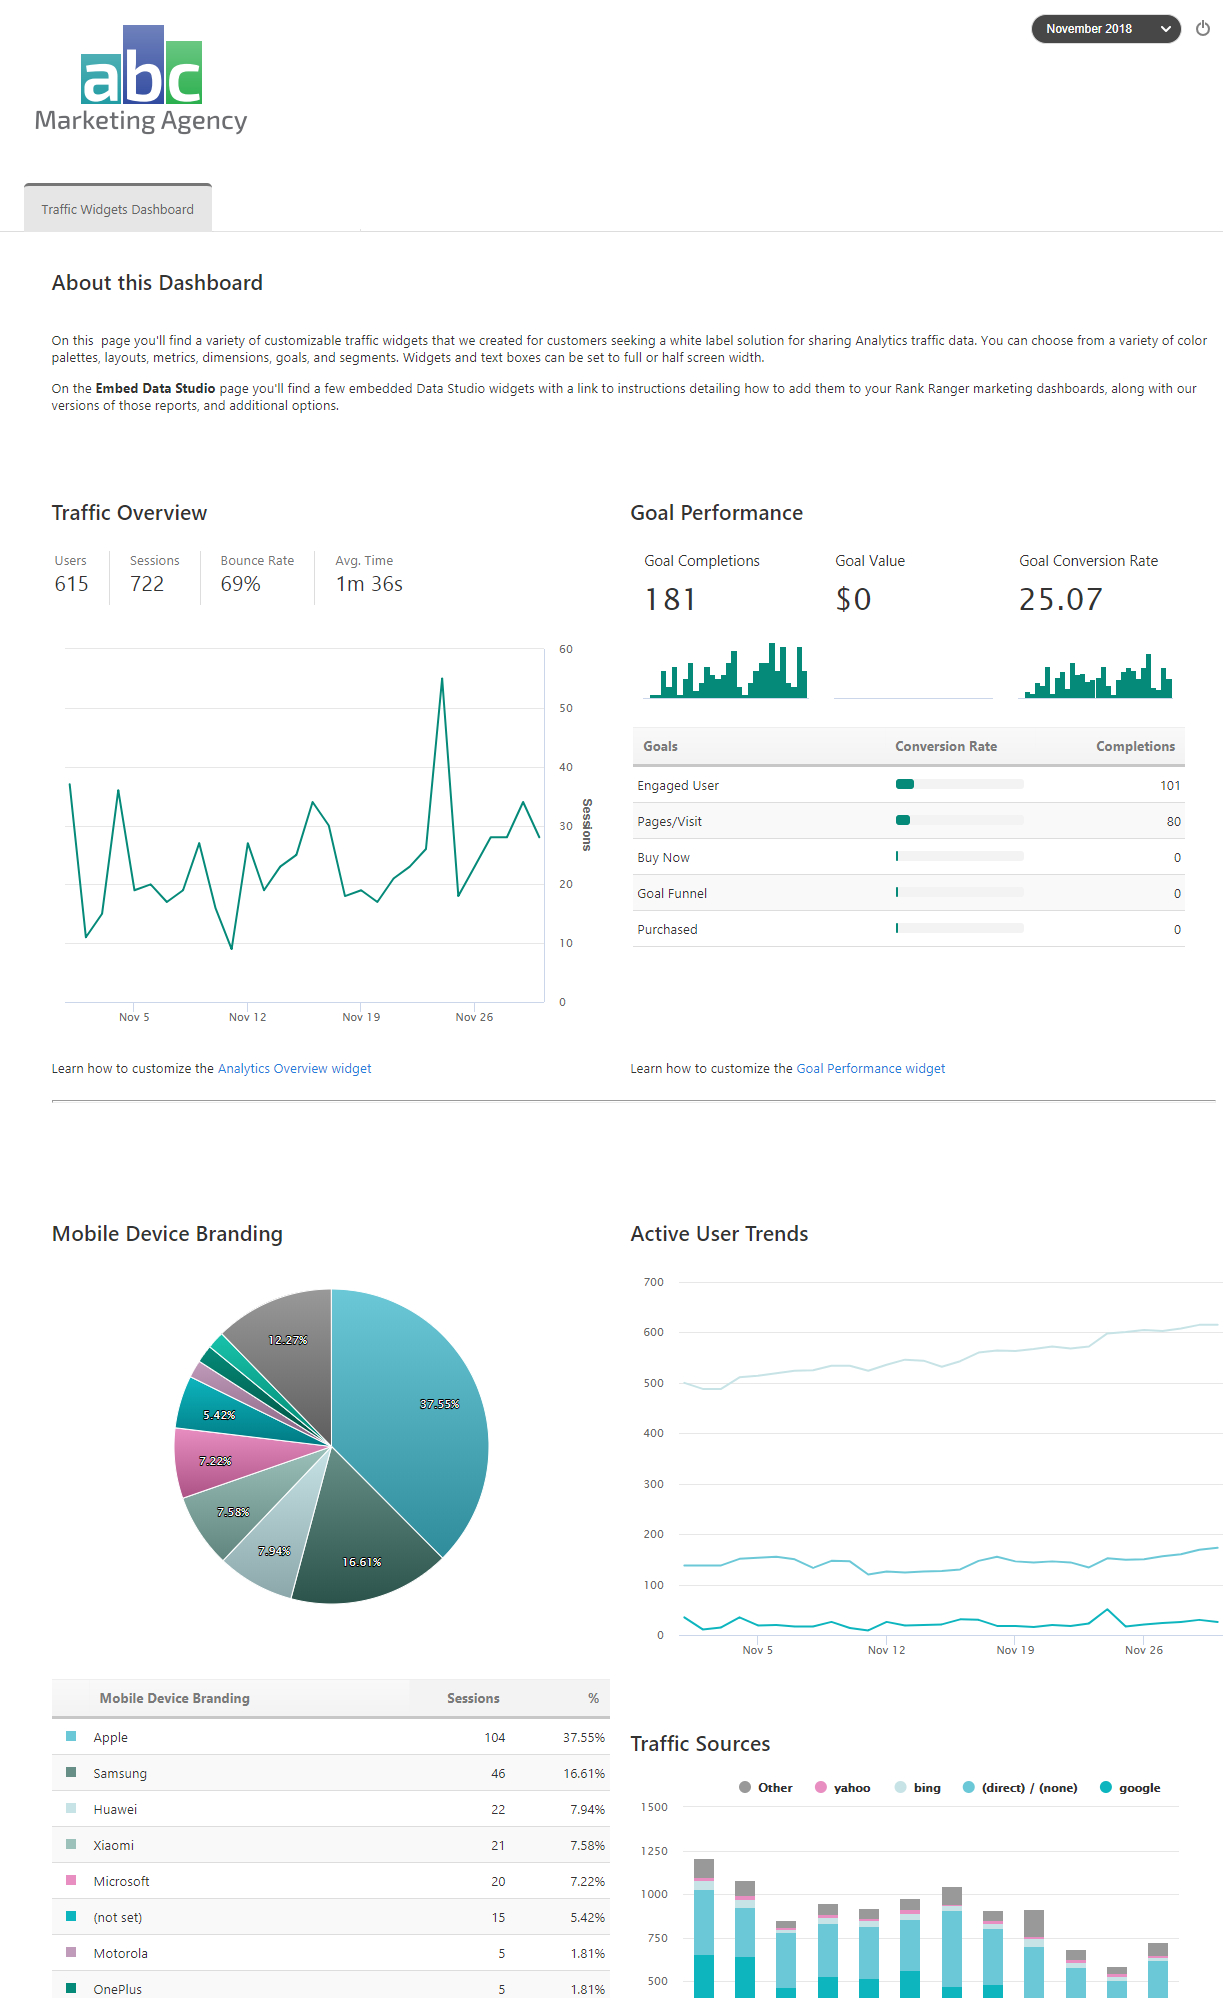
This template uses the Fixed Date setting. This Single Page Dashboard template contains the following Google Analytics widgets: