Job Insights Glossary
Rank Ranger's Job Insights is a unique service that can help you improve the visibility of your job listings by analyzing the competition and surveying the job marketing within the
Google for Jobs search engine.
This glossary provides a brief explanation of the terms used in our Job Insights tool.
Job Insights is a premium stand-alone subscription service, if you aren't already subscribed and are interested in learning more, please
contact our service team.
Located in the Market Analysis > Category Trends report, the Best Paying Jobs table lists the job title, average salary, and a number of Google Jobs listings per job title during the report.
Best Position refers to the best rank of the keyword achieved during the date range (if Historical Data selected) or in the past 7 days (if Fresh Data selected).
In the context of the Category Trends report (located in Market Analysis), the Change metric refers to the number of New Jobs divided by the Total Jobs.
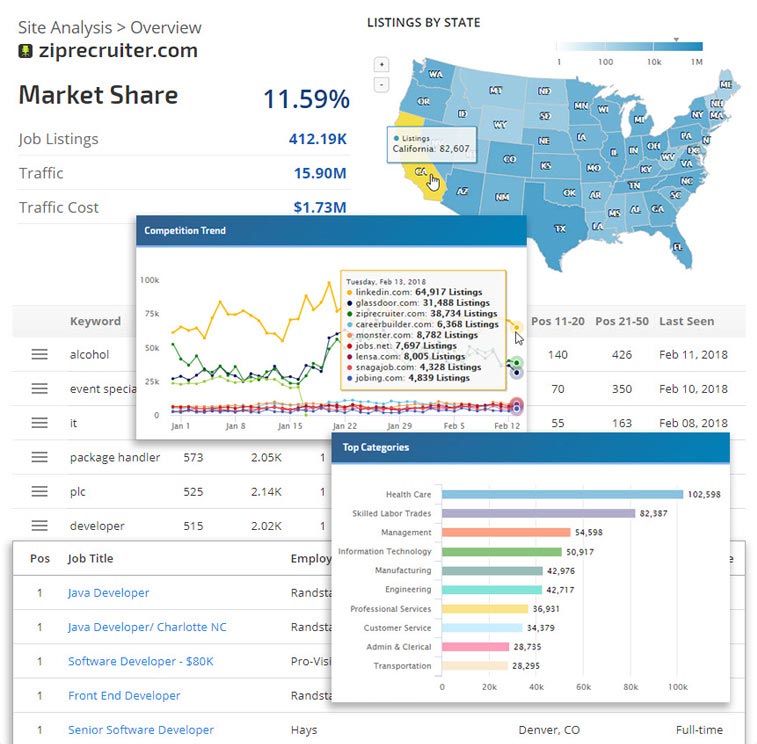
The Competition Trend graph provides a visual of the top competitors over a 6 week period. Hover over any point on the graph to view the number of job listings per job board on a specific date based on the selected search location
Efficiency is a visibility score based on exact keyword match in job titles and listing positions in the search results.
Companies whose advertised job listings have ranked in Google Jobs search. In the various graphs and table listings, you'll find either the employer name (sometimes including a link to the actual job listing) or the number of unique employers with job listings for each search location.
If published in the job listing, the employment type is included in various graphs and tables as Full-time, Part-time, Contractor, Internship, or not set (the job listing did not define the employment type).
The Employment Type graph displays the number of job listings in each employment type for the domain and selected search location.
Fresh Data is based on the past 7 days.
In the context of the Market Analysis > Category Trends report Job Listings Trend table, Growth represents the number of new job listings in the current report period minus the number of new job listings during the previous reporting period, divided by the new job listings in the previous period.
Historical Data is based on the selected date range.
A job board is any website that has a Jobs section and pushes job ads to Google's Jobs API.
The total number of job ads published on
Google for Jobs for the selected domain and search location.
The Job Location is based on the location indicated in the job listing in
Google for Jobs.
The Job Title is listed in the job ad in
Google for Jobs. In some reports, the Job Title links to the actual job listing or to a Keyword Performance report that provides additional insights.
The search keyword or phrase that was used to perform a search in the
Google for Jobs search engine and resulted in a top 100 ranked (position) job listing.
The last date that the keyword and search location produced a job listing for the employer in
Google for Jobs search.
Listings are job ads. The content of listings is provided in a variety of graphs and tables.
A USA map that provides the number of job listings for the domain in each state when you hover over a state.
In the Overview report, clicking on a state reveals a downloadable list of cities and the number of job listings in each.
The domain's share of job listings published on Google Jobs for the selected search location.
Most Effective Job Titles
The Job titles with the most listings and highest visibility are based on search position.
The Job titles with the most listings for the selected report filters (e.g., domain, search location, category, etc.).
New Jobs (Listings Trend)
The New Jobs metric in the Market Analysis > Category Trends Job Listings Trend table represents the total of new job listings (i.e., job ads that were not previously found in the top 100 results of Google Jobs search) for each category during the reporting period.
# Days is the number of days since the job listing was first recorded in our database.
Popularity is a score based on the percentage of instances where the job title is an exact match of the keyword (as opposed to containing the keyword, e.g., "analyst" is contained in, but is not an exact match for the keyword "data analyst").
Pos 1-3, Pos 4-10, Pos 11-20, Pos 21-50
The number of job listings ranked in
Google for Jobs search in Positions:
- 1 through 3
- 4 through 10
- 11 through 20
- 21 through 50
The Rank Distribution graph displays the number of job listings that ranked in positions 1-3, 4-10, 11-20, and 21-50 for the domain and selected search location.
The Salaries By Location chart that is located in the Market Analysis > Category Trends report graphically displays the top 10 highest paying salaries per location. This is based on the selected reporting period.
The salary or salary range if published in the job listing.
Salary Distribution Graph
If salary data is provided in job listings for the selected domain, the Salary Distribution graph displays salary ranges and the number of job listings in each range.
Search Location is the physical location that the
Google for Jobs keyword search was performed from. Rank Ranger currently tracks the top 50 US cities (based on population).
The percentage of share of all listings for the employer/competitor/city/domain/job title, based on searches conducted from the selected search location.
Rank Ranger searches
Google for Jobs from the top 50 US cities (based on population). Sub locations represent the number of all the cities found when grouping and counting unique job locations, including the search location city. You can see an example of this by clicking a State on the Listings by State map and viewing the list of cities.
Top job categories based on the number of listings for the domain and selected search location.
Cities with the largest share of job listings based on searches conducted from the selected search location. Clicking the city name launches the Keyword Performance report for that search location.
The Top Competitors list rates job boards based on a number of listings. The list includes competitor domain (with a link to their domain overview report for additional insights), a number of job listings, estimated cost of advertising, and estimated search traffic.
The Top Employers list rates, employers, based on their number of job listings in
Google for Jobs search for the selected search location, and provides their percentage of share. Clicking the employer name launches a Keyword Performance report for the domain that is filtered by the employer name.
Top Job Boards - Total Listings Graph
The Top Job Boards by Total Listings graph displays the job boards with the highest number of listings in the
Google for Jobs search results.
Top Job Boards - Visibility Score Graph
The Top Job Boards by Visibility Score graph displays the job boards with the highest visibility score (based on the number of listings ranked in the top 30 results of the
Google for Jobs search results. The more top positions in the top 30 results, the higher the visibility score is).
The Top Keywords table contains a list of the keywords with the highest
Google for Jobs search engine rank position based on the search location. A Traffic metric provides the share of traffic the keyword holds in the listings space for the domain.
The Top Locations list rates Job Locations based on the number of listings in
Google for Jobs search and provides their percentage of share.
Top Salaries By Job Title
The Market Analysis > Category Trends report includes a chart that displays the Top 10 highest salary job titles, along with the number of listings in Google Jobs for the selected report period.
Top Search Locations List
For the top 50 US cities (based on population), this table provides job listing statistics including search location, number of listings, number of sub-locations, number of employers, rank position and estimated organic traffic for the domain.
Total Jobs (Listings Trend)
The Total Jobs metric in the Job Listing Trends table of the Market Analysis > Category Trends report represents all of the listings for each category during the selected report period.
The Total Listings Trend graph located in the Market Analysis > Category Trends report displays total listings per day for all categories spanning the selected report period.
The estimated traffic is based on the organic search volume and the actual position of an ad. Meaning the higher rank the ad achieves, the higher share of the estimated search volume it will get. Search volume is an estimation of how much traffic a site or URL could potentially get from organic traffic. The database of keywords used in this tool may not contain every possible search query that people might enter in Google and that is why this metric is treated as an estimate and not exact values. It should be used for comparing websites with each other and analyzing trends in search traffic over time.
Similar to the traffic metric, Traffic Cost is an estimated advertising cost based on keyword average cost per click for the keywords in our database related to the job listings.
Unique Employers (By Domain)
The Unique Employers (By Domain) chart displayed in the Market Analysis > Category Trends report represents the total number of unique employer domains (websites) found (for the keywords in our database) with listings in Google Jobs during the reporting period.
Unique Employers (By Name)
The Unique Employers (By Name) chart that is located in the Market Analysis > Category Trends report provides the number of listings attributed to unique employer names found in Google Jobs listings during the report date range for the keywords that are in our database.
Unique Job Boards (By Domain)
The Unique Job Boards (By Domain) chart displayed in the Market Analysis > Category Trends report graphically illustrates the total number of listings per day in Google Jobs for unique job board websites (domains) for the keywords that are tracked in our database.
Unique Job Boards (By Name)
The Category Trends report Unique Job Boards (By Name) chart displays the total number of Google Jobs listings attributed to unique job board names per day during the reporting period for the keywords that our system tracks.
The Visibility score is calculated by aggregating the weighted rank value of a company's listings that appear in the top 30 positions in
Google for Jobs. For example, each keyword producing a position #1 rank scores 30, #2 gets 29, #3 gets 28, and so on, and they’re added together to form the Visibility score.