The Landing Page Traffic Insights report provides an opportunity to analyze search traffic and user behavior from Google Analytics and Search Console in one report, to determine how (or if) they correlate. It also helps you discover Not Provided keywords.
The report only includes Landing Pages that are reported by Google to have at least 10 unique sessions from organic traffic during the report period.
Important! To view this report Google Analytics and Search Console must be configured correctly, please refer to our Google Analytics and
Search Console integration documentation.
- SEO
- Rank Tracker
- Local SEO
- Mobile SEO
- Link Manager
- Landing Pages
- Social Signals
- On-Page Optimization
- Enterprise SEO Solutions
- Marketing
- Competition Analysis
- Insight Graph
- Keyword Research
- Graphs & Widgets
- Market Reach
- Marketing KPI
- Brand Visibility
- White Label SEO
- Marketing Dashboard
- Client Dashboard
- PDF Reports
- PDF Templates
- Other
- Email Notifications
- Portfolio Management
- Integrations
- Google Analytics
- Search Console
- Pay Per Click
- WeDevelop
- API
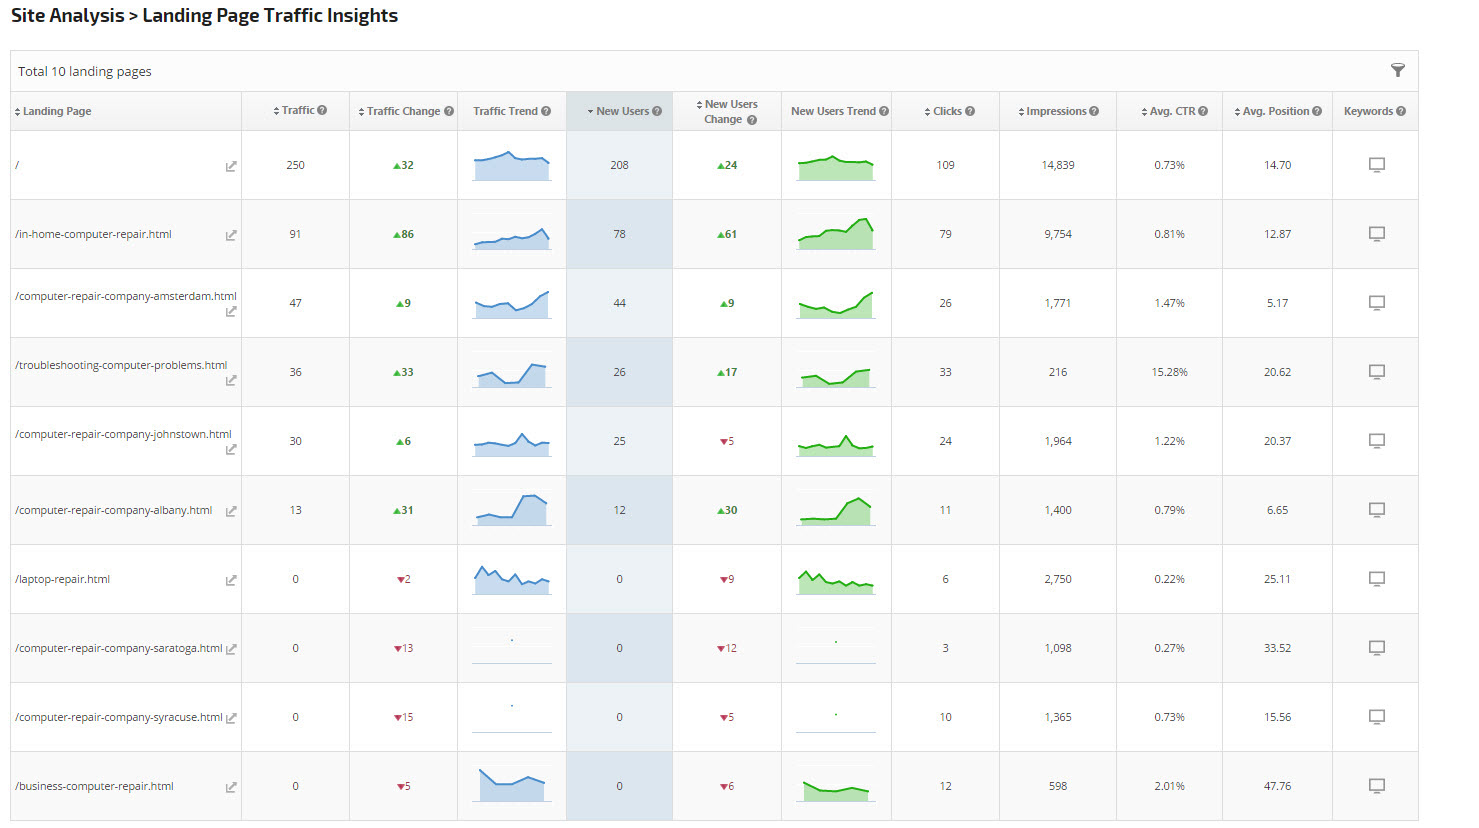
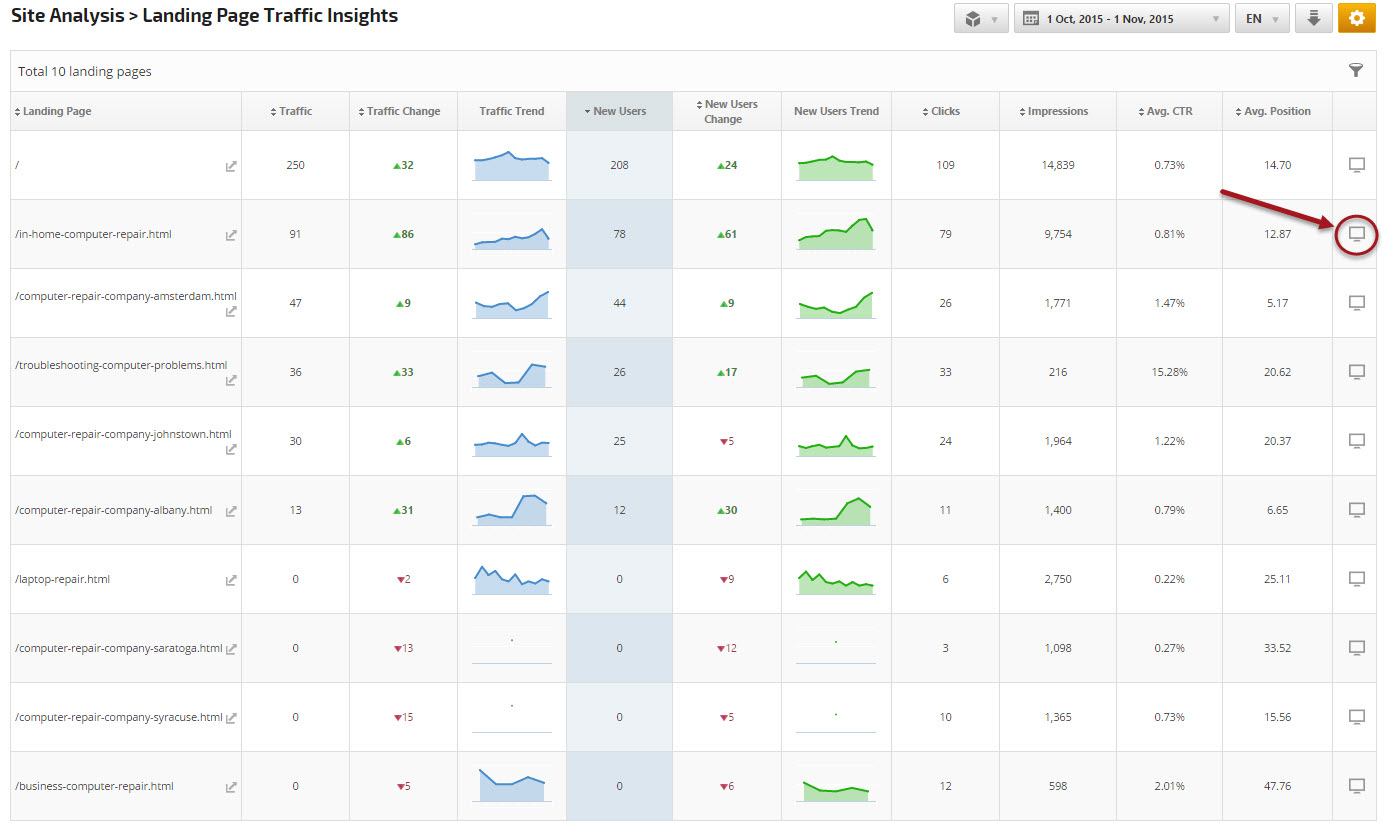
Landing Page Traffic Insights
Located in Reports & Tools> Organic Search > Rank Tracking > Landing Pages
Blended Google Analytics Traffic and Search Console Data
Select a date range and analyze search traffic and user behavior. In order to draw accurate correlation between New Users and Clicks, please select a date range that is at least 3 days prior to the current date because it takes Google Search Console approximately 3 days to gather and provide click, impressions, CTR and position data.
Google Analytics Landing Page Traffic Trends
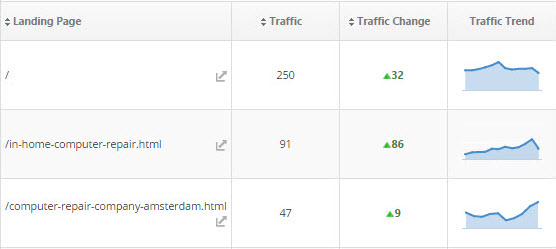
Google Analytics organic traffic, traffic change and a traffic trend graph provide insights into how specific landing pages are performing.
Traffic
Traffic represents the number of sessions filtered by organic medium from all search engines as reported by Google Analytics.
Traffic Change
The change in organic search traffic from the last calendar month compared to the first calendar month data in the Trends graph.
Traffic Trend
The trend of organic search traffic during the most recent 12 full calendar months (provided the site has been tracked on Google Analytics for at least 12 months).
Select a date range and analyze search traffic and user behavior. In order to draw accurate correlation between New Users and Clicks, please select a date range that is at least 3 days prior to the current date because it takes Google Search Console approximately 3 days to gather and provide click, impressions, CTR and position data.
Google Analytics Landing Page Traffic Trends
Google Analytics organic traffic, traffic change and a traffic trend graph provide insights into how specific landing pages are performing.
Traffic
Traffic represents the number of sessions filtered by organic medium from all search engines as reported by Google Analytics.
Traffic Change
The change in organic search traffic from the last calendar month compared to the first calendar month data in the Trends graph.
Traffic Trend
The trend of organic search traffic during the most recent 12 full calendar months (provided the site has been tracked on Google Analytics for at least 12 months).
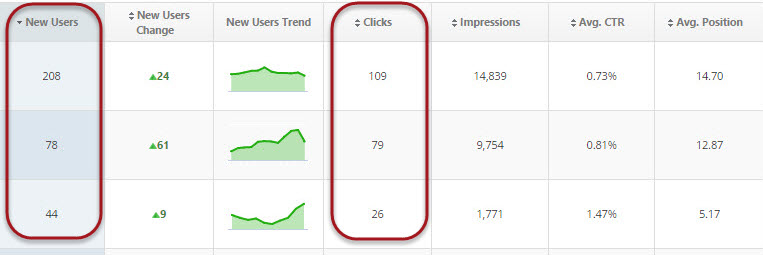
Traffic Segment: New Users
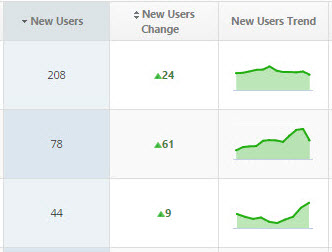
Analyze new user traffic by landing page with Google Analytics New Users change and trends over the past 12 full calendar months.
New Users
The number of first-time users during the selected date range as reported by Google Analytics.
New Users Change
Change in the number of first-time users during the last calendar month compared to the first calendar month data in the Trends graph.
New Users Trend
The trend in the number of first-time users during the most recent 12 full calendar months (provided the site has been tracked on Google Analytics for at least 12 months).
Search Performance
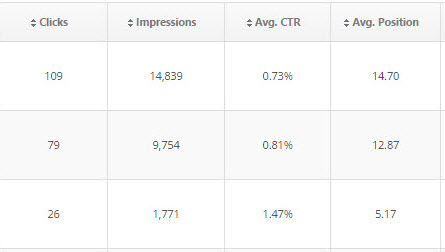
Learn about user search behavior for each landing page by analyzing clicks, impressions, average CTR and average position as reported by Google Search Console.
Learn about user search behavior for each landing page by analyzing clicks, impressions, average CTR and average position as reported by Google Search Console.
Clicks
Count of clicks from a Google search results page that landed the user on your property.
Impressions
The number of links to your site displayed in the user session on Google search results, even if the link was not scrolled into view. However, if a user views only page 1 and the link is on page 2, the impression is not counted. The count is aggregated by site or page. With infinitely scrolling pages, such as image search, the impression might require the item to be scrolled into view.
Average CTR
Average click-through rate: the click count divided by the impression count. If a row of data has no impressions, the CTR will be shown as a dash (-) because CTR would be division by zero.
Average Rank Position
The average position of the topmost result from your site. So, for example, if your site has three results at positions 2, 4, and 6, the position is reported as 2. If a second query returned results at positions 3, 5, and 9, your average position would be (2 + 3)/2 = 2.5.
Correlation between New Users and Clicks
Gain insights from the correlation between new users and clicks. Please note that in order to draw accurate correlation between New Users and Clicks, you need select a date range that is at least 3 days prior to the current date because it takes Google Search Console approximately 3 days to gather and provide click, impressions, CTR and position data.
Gain insights from the correlation between new users and clicks. Please note that in order to draw accurate correlation between New Users and Clicks, you need select a date range that is at least 3 days prior to the current date because it takes Google Search Console approximately 3 days to gather and provide click, impressions, CTR and position data.
Landing Page Keywords
Discover the actual keywords that ranked for the landing page by clicking the screen icon at the end of any row.
Discover the actual keywords that ranked for the landing page by clicking the screen icon at the end of any row.
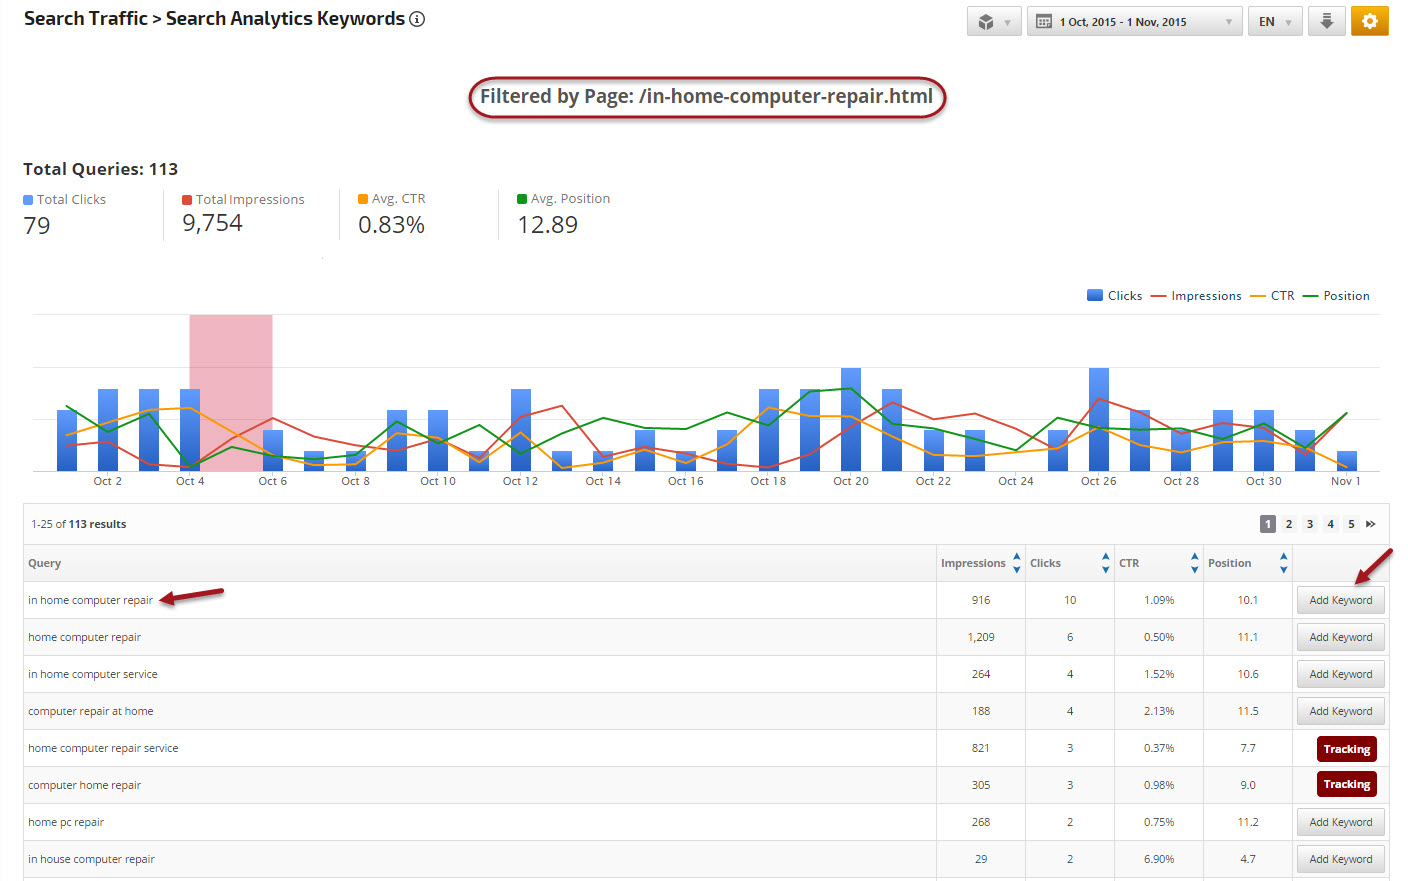
Search Analytics Keywords
The Search Analytics Keywords report launches filtered by the landing page you selected in the Landing Page Traffic Insights report and reveals Not Provided keywords.
In this report view you can see the the keyword that led users to click through to the site, along with the number of impressions, clicks, CTR, and rank position of each keyword. There is also an indicator of whether the campaign is currently tracking the keyword and if not there is an option to add a keyword to the campaign.
 |
Report Dates:
|
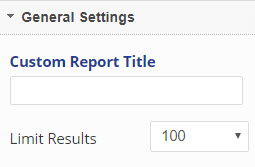 |
General Settings:
|
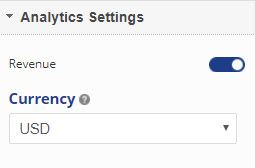 |
Analytics Settings:
|
.
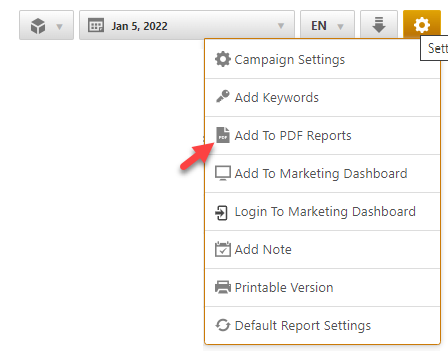
Add to PDF Report
Conveniently add a report or graph with its current settings to a PDF report by hovering over the gold gear icon and selecting Add to PDF Reports
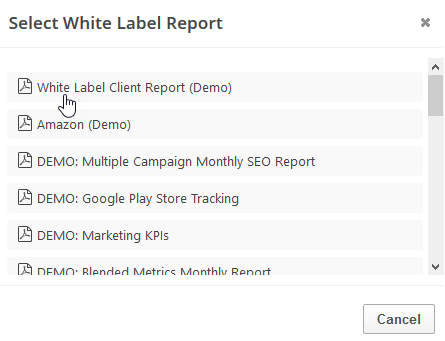
Select the PDF Report that you want the report or graph added to
Drag the new report or graph into the position you want it to display in the PDF and confirm that the Date settings do not conflict with the automated scheduling settings.
PDF Report Settings - Landing Page Traffic Insights
Reports and graphs can be added to automated PDF reports via the report screen (as described above) or manually in the PDF Report Content screen. If the report is added via the:
- report screen, then begin by clicking the Edit button corresponding to the report
- PDF Report Content screen, then click the Add Report button and select the Campaign name and Report: Landing Page Traffic Insights.
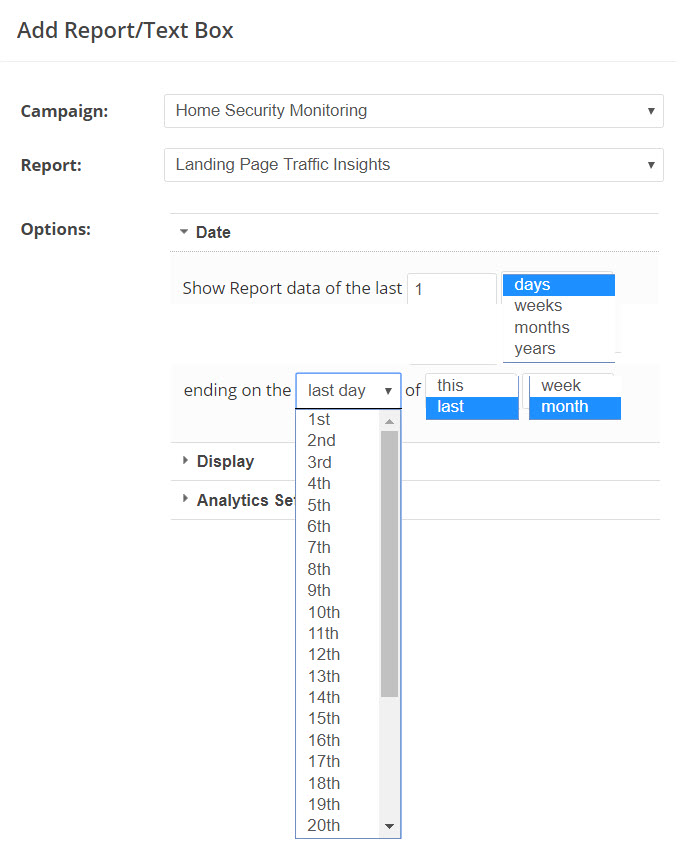 |
DateExpand the Date Options section and in the Show Report date of the last field type in the number of periods to be displayed in the report In the next field select one of the following options:
|
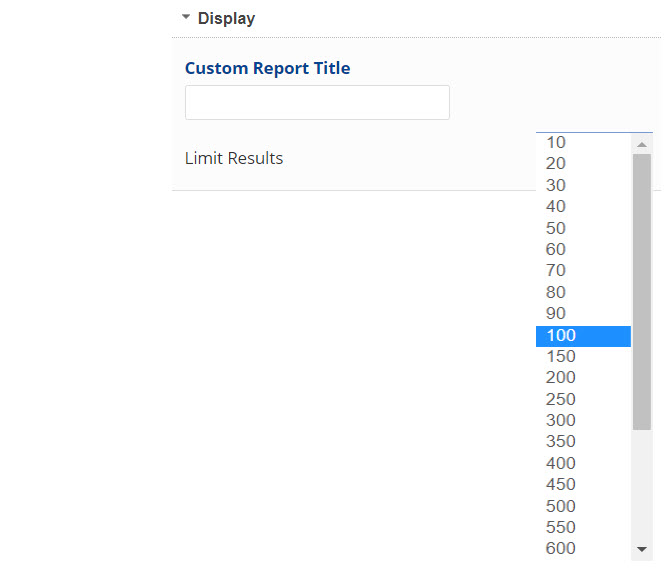 |
DisplayCustom Report Title (optional): displays across the top of the report section. Limit Results by selecting the number of results from the menu. |
|
|
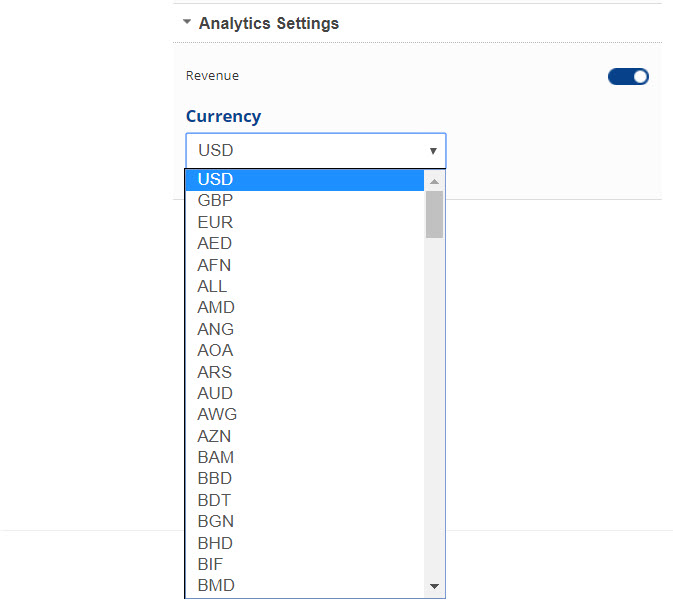
Analytics SettingsDisplay Revenue for the Google Analytics Ecommerce Revenue metric. Select the Currency symbol you want displayed (the default setting is the one being used in the Google Analytics account. If the currency you have set up in Google doesn't pass correctly through the Google Analytics API to your report, you can change the currency symbol with this setting.) |
Add to Marketing Dashboard
Conveniently add a report or graph with its current settings to a marketing dashboard:
1. Hover over the gold gear icon and select Add to Marketing Dashboard
2. Select the Dashboard (campaign name)
3. Select the Dashboard Page that you want the report added to

1. Hover over the gold gear icon and select Add to Marketing Dashboard
2. Select the Dashboard (campaign name)
3. Select the Dashboard Page that you want the report added to
4. Click the "Go to Dashboard" link to further customize the report (e.g., drag it to a specific position on the page, change date settings, etc.)

Refer to the Report Options section for details regarding the display settings, filters and sort options available for this report.
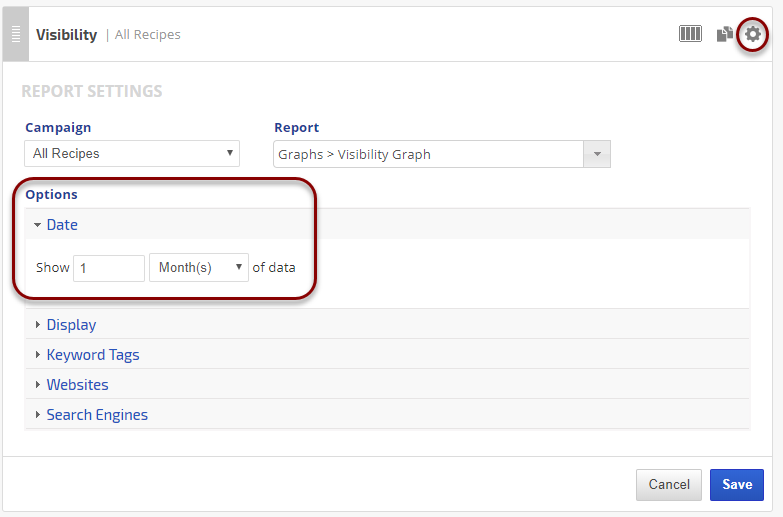
The report date (or date range) is governed by the selected Dashboard date option: Date Selection or Fixed Periods, learn more...
- Daily reports default to the last day of the selected period
- Weekly and monthly reports default to 1 month of data
Add to Client Dashboard
Customize Report for Client Dashboard
Client Dashboards display our default report options for each individual report and graph until you modify them. To customize the display of the report, expand the Report Options section, change the settings and click the Apply Changes button.
Then expand Report Options again and hover over the Save icon and select Save as Default for Client Dashboard.
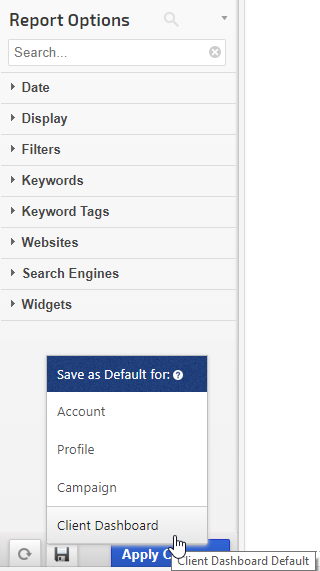
After saving the Client Dashboard default, any changes that you make to the report options will not affect the display in the Client Dashboard unless you overwrite it by following these instructions again.
Client Dashboards display our default report options for each individual report and graph until you modify them. To customize the display of the report, expand the Report Options section, change the settings and click the Apply Changes button.
Then expand Report Options again and hover over the Save icon and select Save as Default for Client Dashboard.
After saving the Client Dashboard default, any changes that you make to the report options will not affect the display in the Client Dashboard unless you overwrite it by following these instructions again.
Enable the Report or Graph to display in the Client Dashboard
Open the Campaign Settings > Client Dashboard screen and check the box corresponding to the report(s) you want displayed in the dashboard, and then click the Save button.
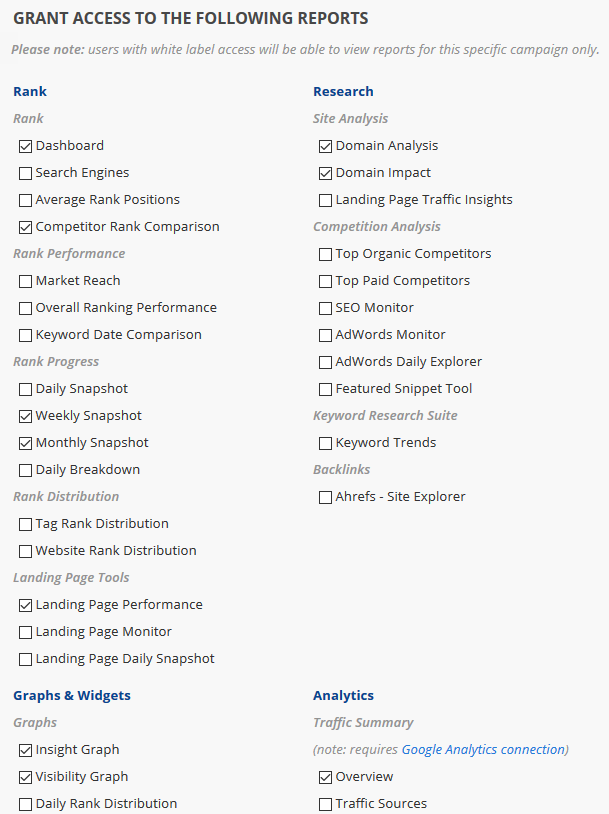
Open the Campaign Settings > Client Dashboard screen and check the box corresponding to the report(s) you want displayed in the dashboard, and then click the Save button.
Refer to Client Dashboard Settings documentation for additional instructions for customizing your dashboard.