Thanks to our White Label feature, our professional reports can become a part of your reputation.
This feature allows you to provide your client with a customized online dashboard displaying our reports, under your logo. This is ideal for SEO companies and online marketing agencies that would like to give their clients the ability to be as hands-on as they like.
For customers with multiple campaigns, the single sign-on feature enables log in to their client dashboard for viewing of SEO
reports and graphs for all of their campaigns in one convenient location.
- SEO
- Rank Tracker
- Local SEO
- Mobile SEO
- Link Manager
- Landing Pages
- Social Signals
- On-Page Optimization
- Enterprise SEO Solutions
- Marketing
- Competition Analysis
- Insight Graph
- Keyword Research
- Graphs & Widgets
- Market Reach
- Marketing KPI
- Brand Visibility
- White Label SEO
- Marketing Dashboard
- Client Dashboard
- PDF Reports
- PDF Templates
- Other
- Email Notifications
- Portfolio Management
- Integrations
- Google Analytics
- Search Console
- Pay Per Click
- WeDevelop
- API
Client Dashboard Settings
Multiple Campaigns can be viewed in one Client Dashboard
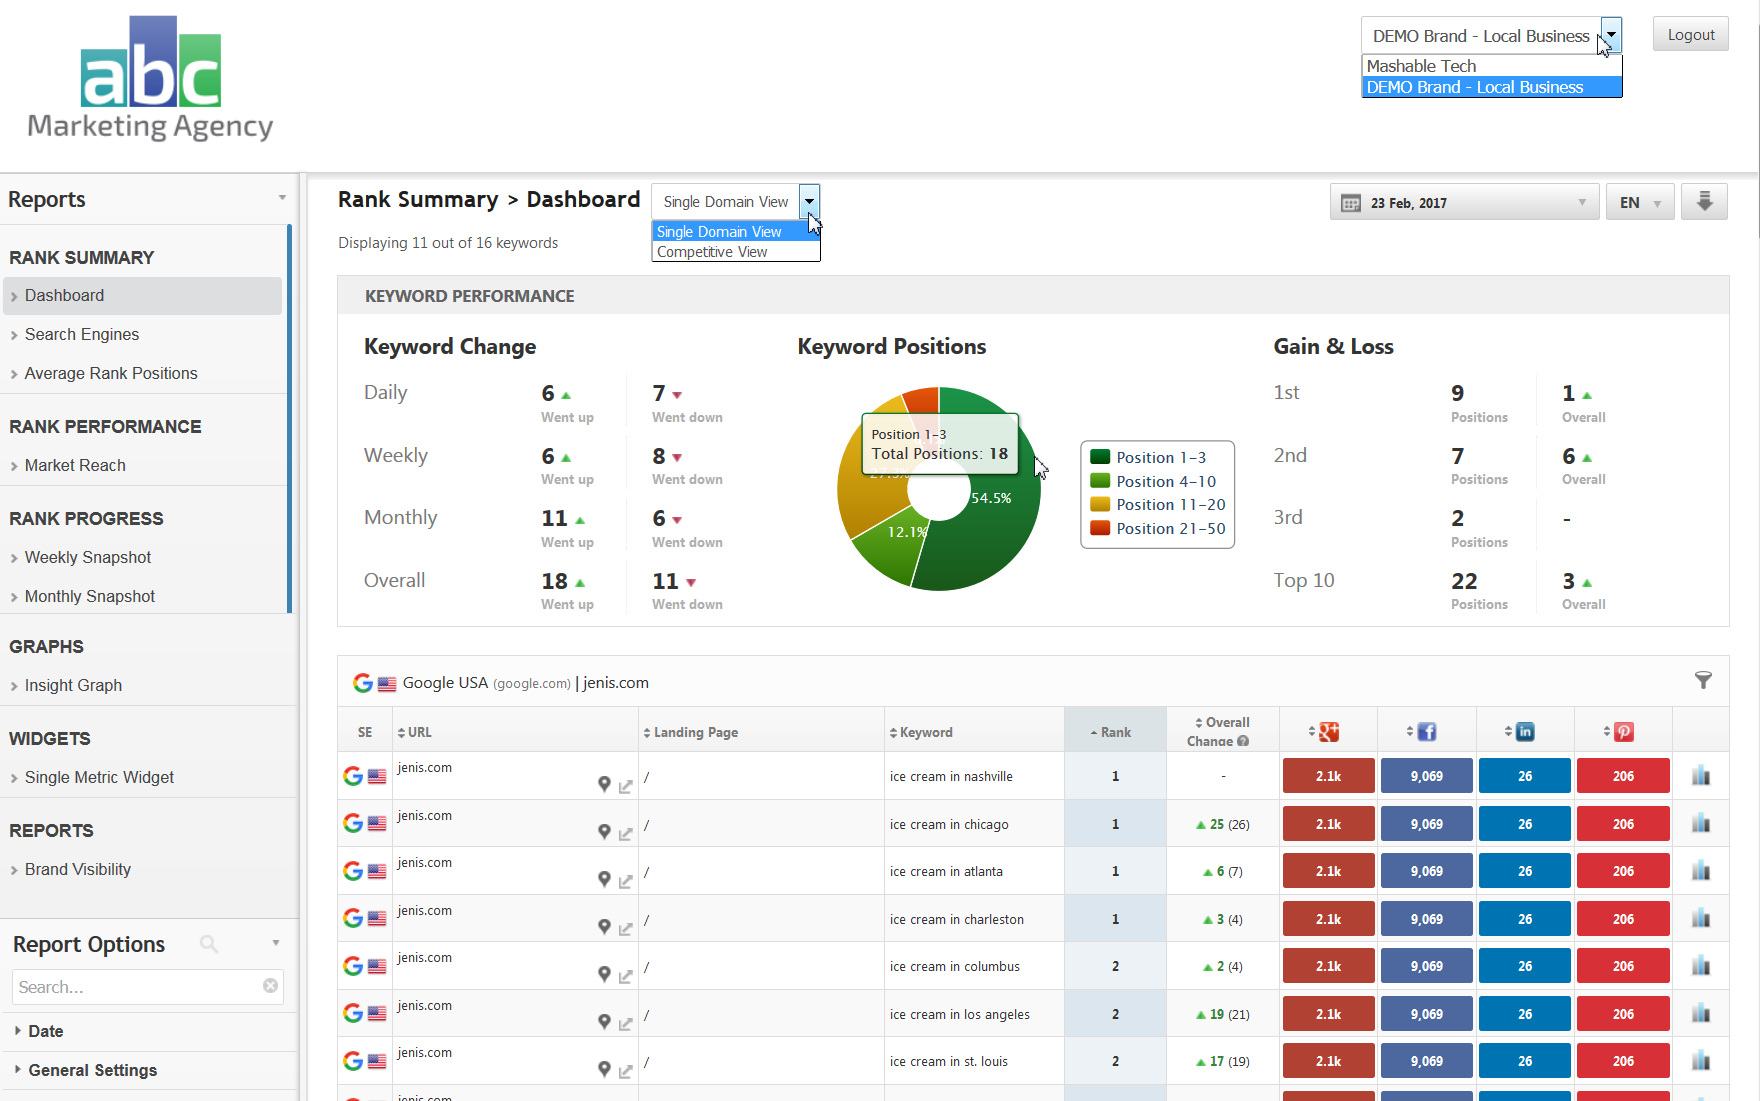
If you have enabled the same Link To Profile in more than one campaign, your customer will be able to select from a list that displays their campaigns in the upper right area of the screen.
If you have enabled the same Link To Profile in more than one campaign, your customer will be able to select from a list that displays their campaigns in the upper right area of the screen.
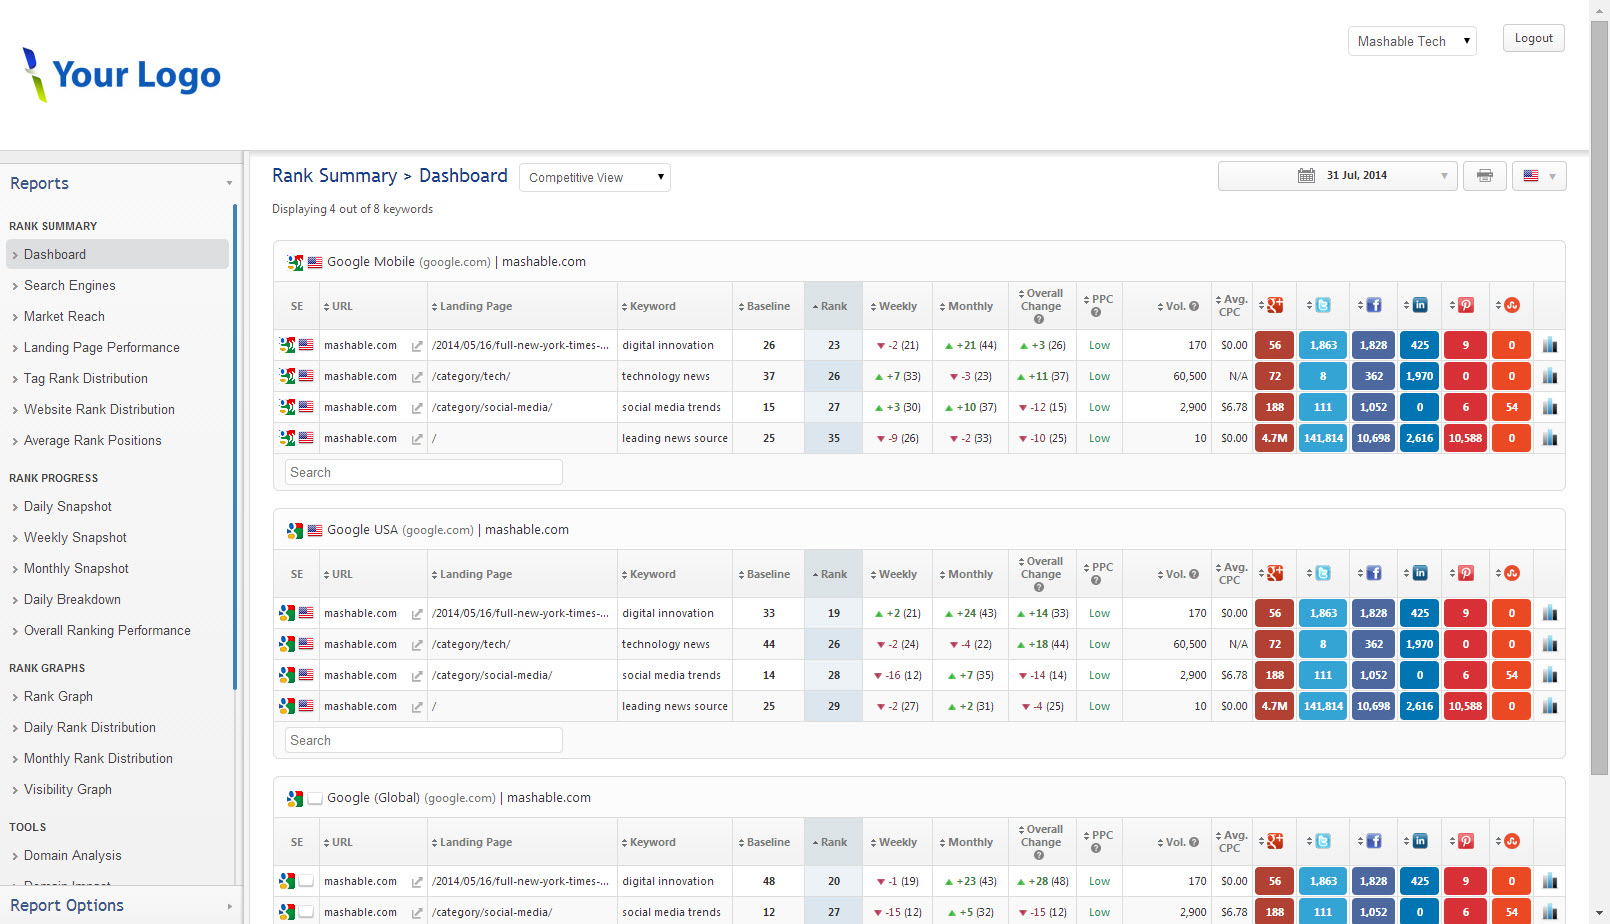
Rank Tracker Dashboard with Multiple Campaigns and Report Options enabled
With these settings, your customer can change report options to view any report or graph you've granted them access to in a variety of formats and customized with the specific metrics they want to see.
With these settings, your customer can change report options to view any report or graph you've granted them access to in a variety of formats and customized with the specific metrics they want to see.
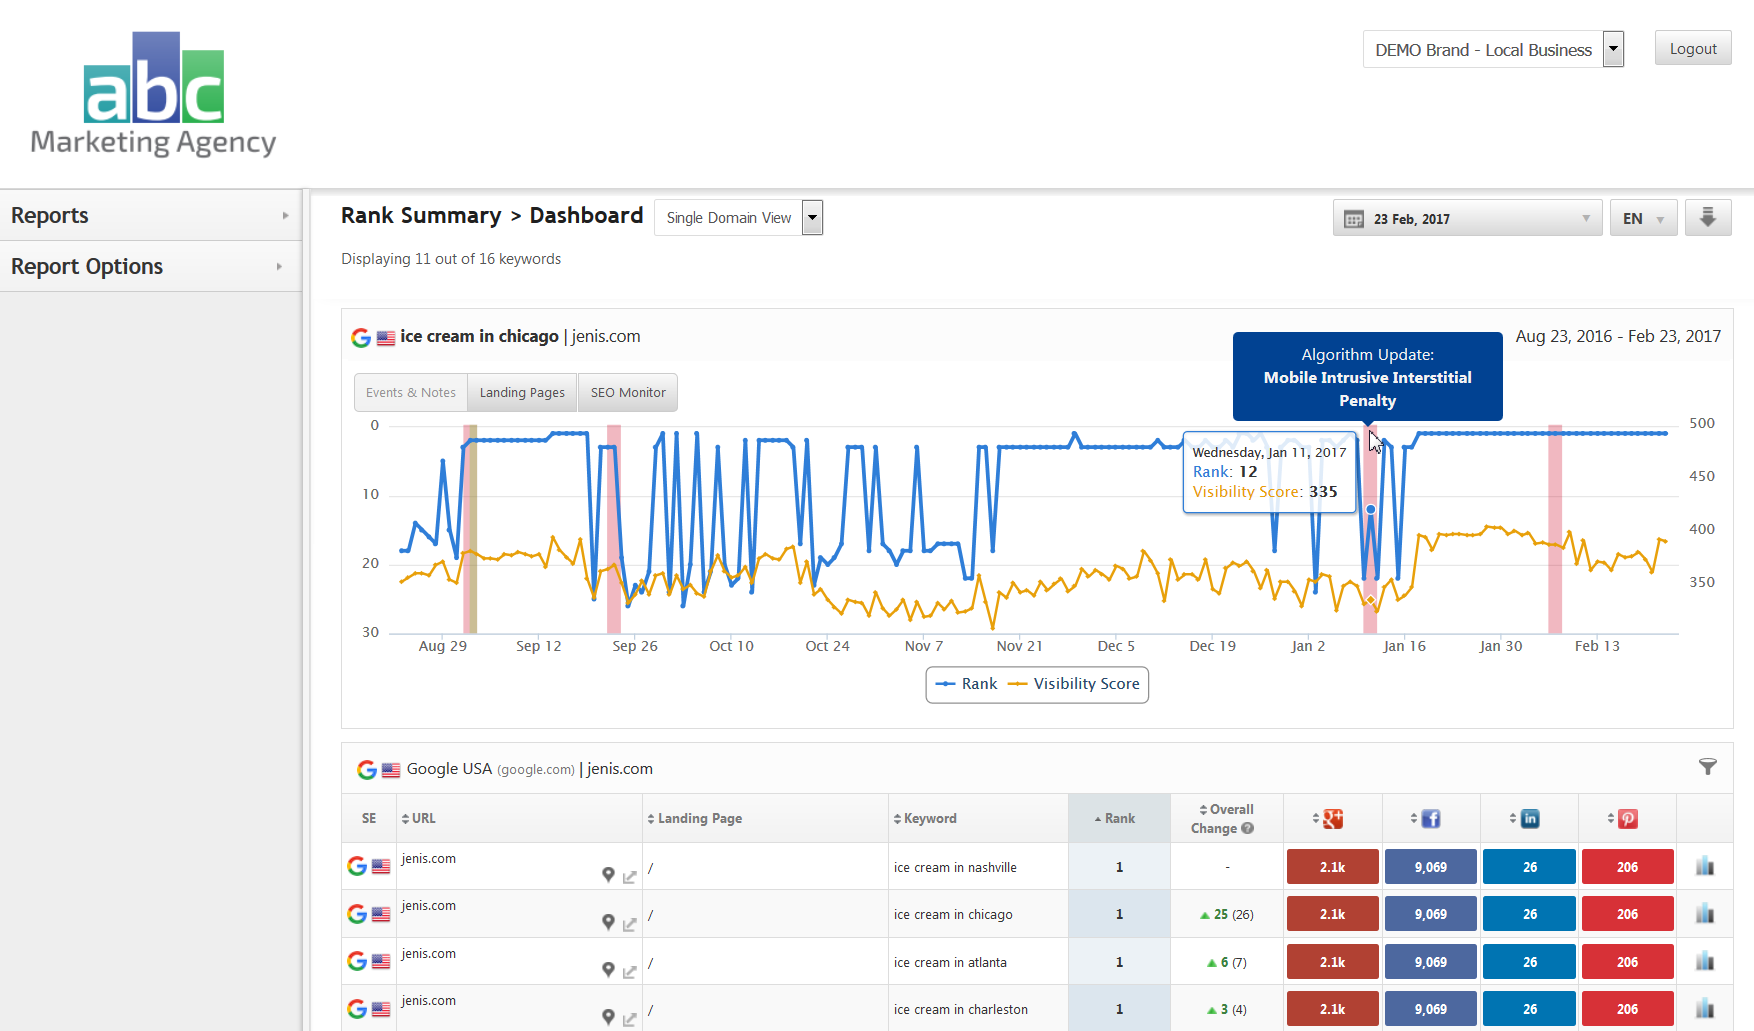
Rank Tracker Dashboard view including Rank & Visibility Graph
Interactive SEO Reports in Branded Client Dashboard
Your customers can interact with reports that you have enabled for them in your branded client dashboards. For example, as in the Rank Ranger user interface that you work in, when viewing the Landing Page Performance report users can click on the number in the Keywords column to reveal the keywords that ranked for the URL displayed in the Landing Page column.
This screenshot also demonstrates what your clients will see if you have disabled Report Options - they can only click on the Reports tab to display the list of reports available to them, but they can't change the options you've set as defaults for a particular report or graph.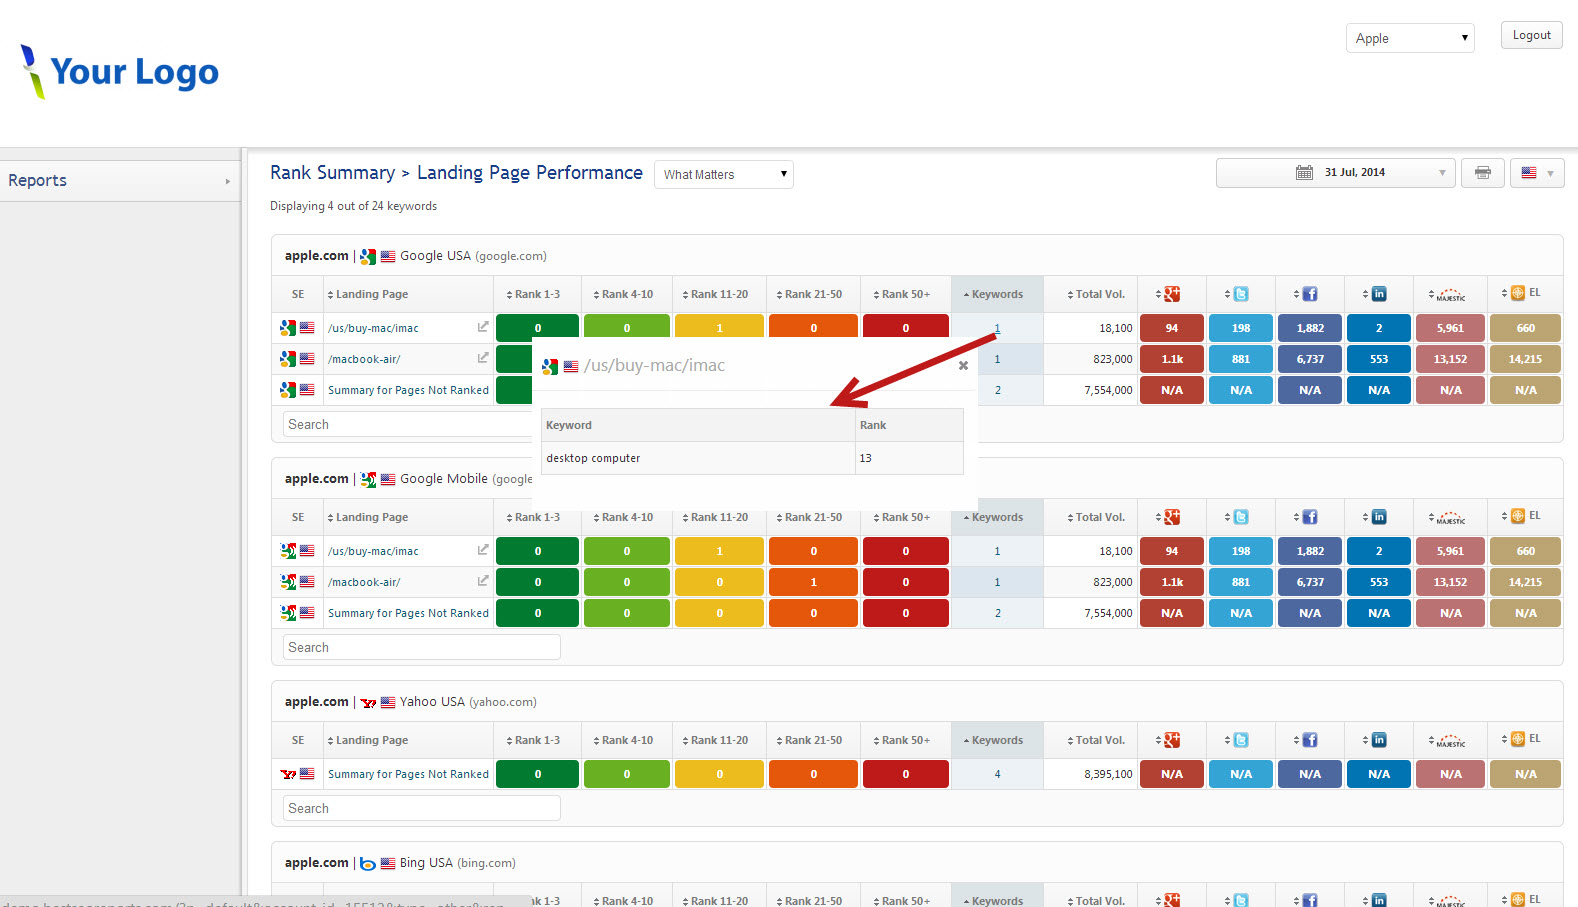
Interactive Hover in Graphs Reveals Additional Data
If enabled in Report Options, your clients can discover algorithm changes by hovering in graphs. Additional rank and traffic data, events, and notes can also be viewed with the interactive hover.
The top right toolbar can be used to change report & graph dates, print reports & graphs, and change the interface language if a language other than English is enabled in the Client Dashboard Campaign Settings.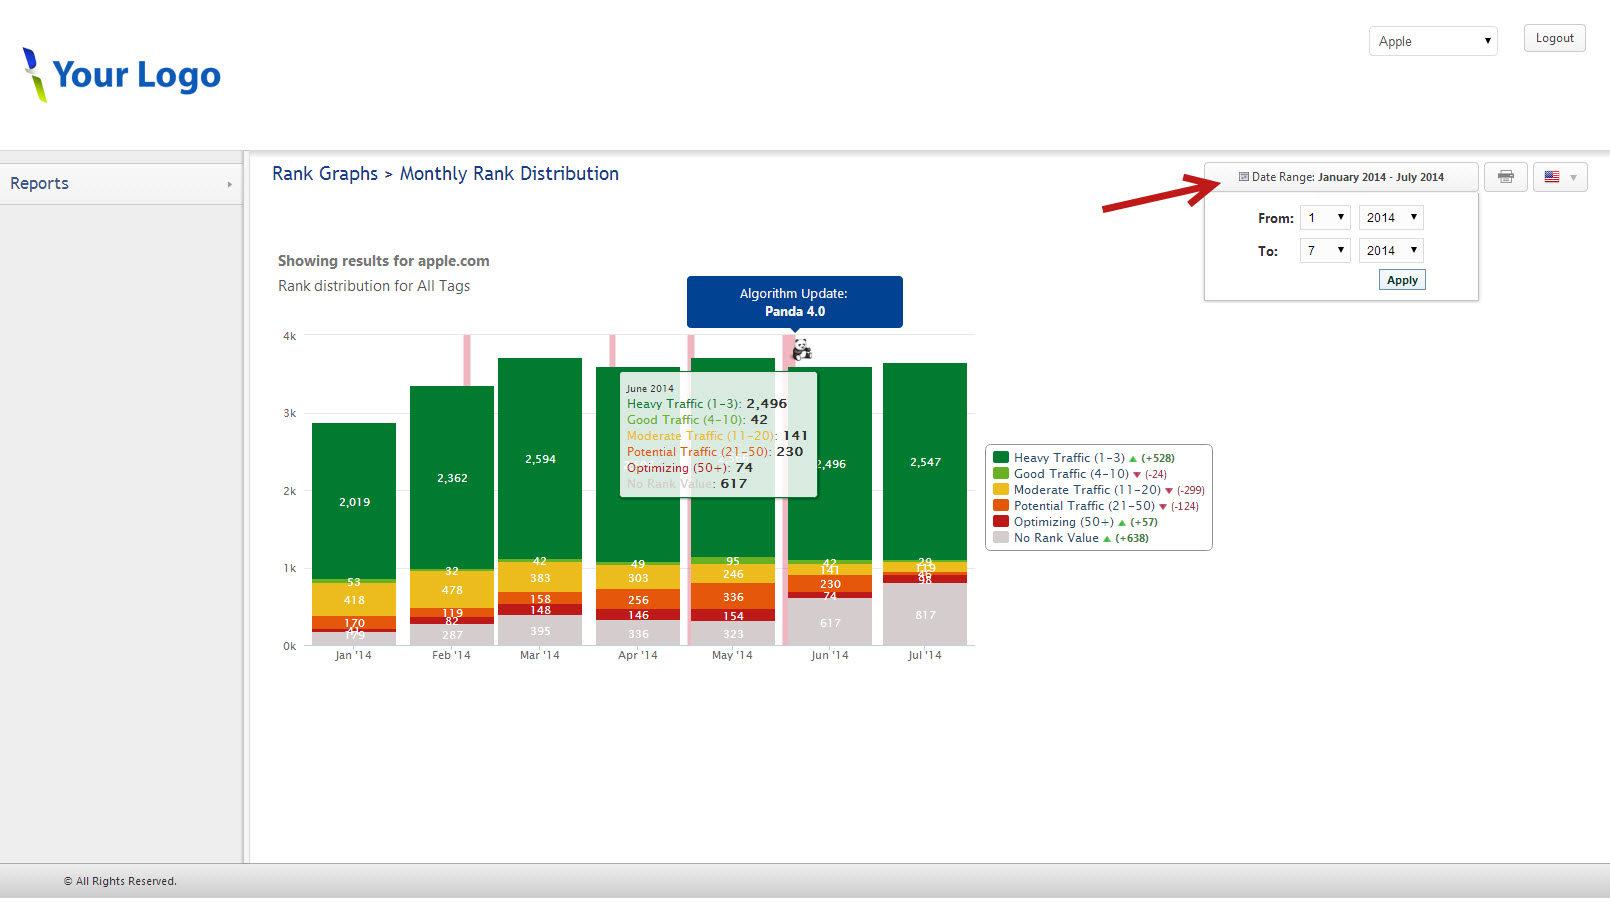
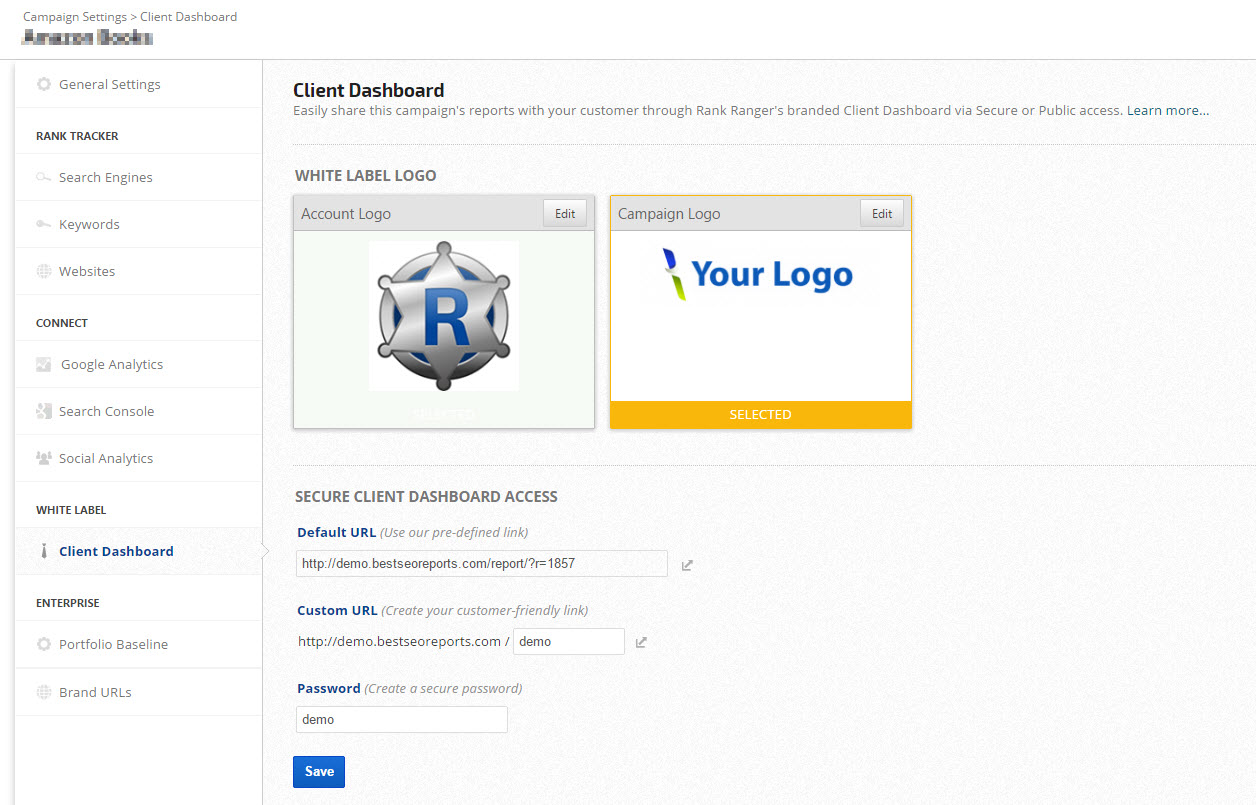 |
Campaign Settings:
|
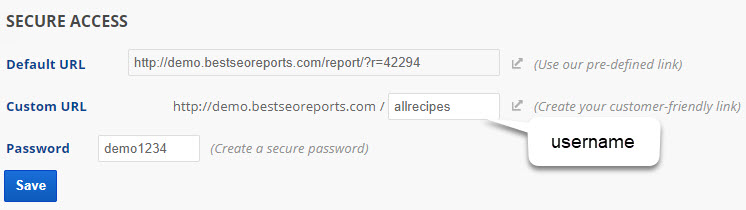 |
Choose from 1 of 3 Access Options:Secure Client Dashboard Password-protected URL
Please note: Your account username becomes the sub-domain in the URL (e.g., demo.ourreports.com), to have your account username changed, please contact customer service and they will check to see if your desired username is available). If you would prefer to use your own domain, you have an option to purchase White Label Custom Domain Service. |
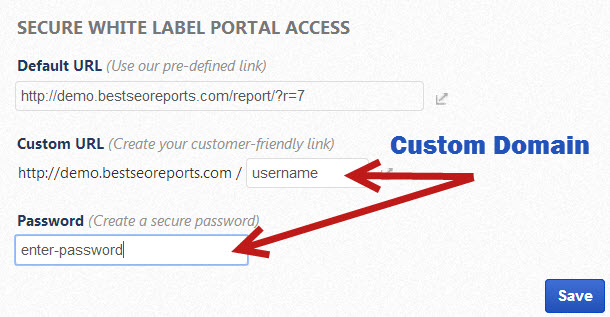 |
Custom Domain Service If you have a package with White Label Custom Domain Service, you can provide your customers with your custom URL (e.g., http://sub.yourdomain.com) and a username and password:
|
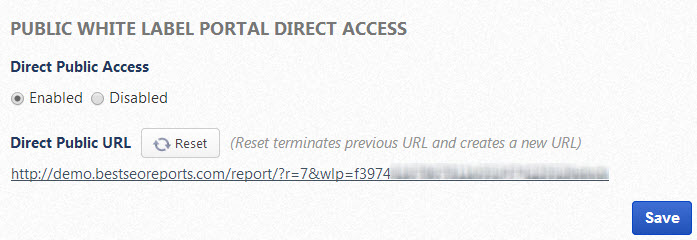 |
Public Client Dashboard Direct Link
|
 |
Access Settings:
|
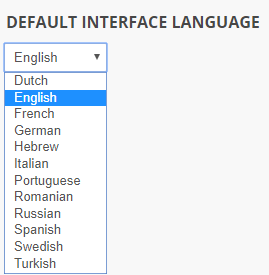 |
Default Language
|
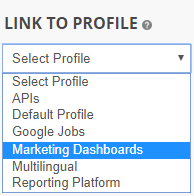 |
Link To Client Profile
Refer to Campaign General Settings > Advanced Settings for instructions on how to assign a Profile to a campaign. |
Display Options
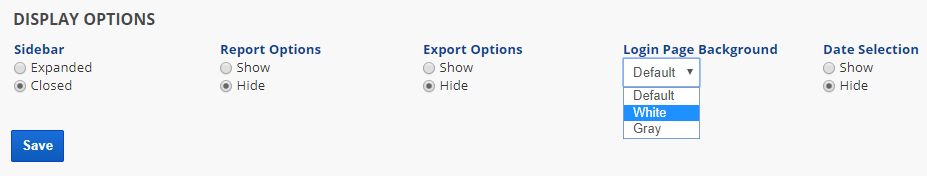
- Sidebar: This option allows the sidebar to be Expanded or Closed when the dashboard is launched (and when switching between reports)
- Report Options: This option allows you to Show or Hide the Report options section (e.g., if you don't want the viewer to be able to change report or graph settings, then set this to Hide)
- Export Options: This option allows you to Show or Hide the Export options (e.g., if you don't want the viewer to be able to download reports, then set this option to Hide)
- Login Page Background: leave as Default or select white or gray
- Date Selection: This option allows you to Show or Hide the Date selection option (e.g., if you only want the viewer to be able to see the reports for the dates as you have set for each report or graph in the report options, then set this option to Hide).
- Click the Save button.
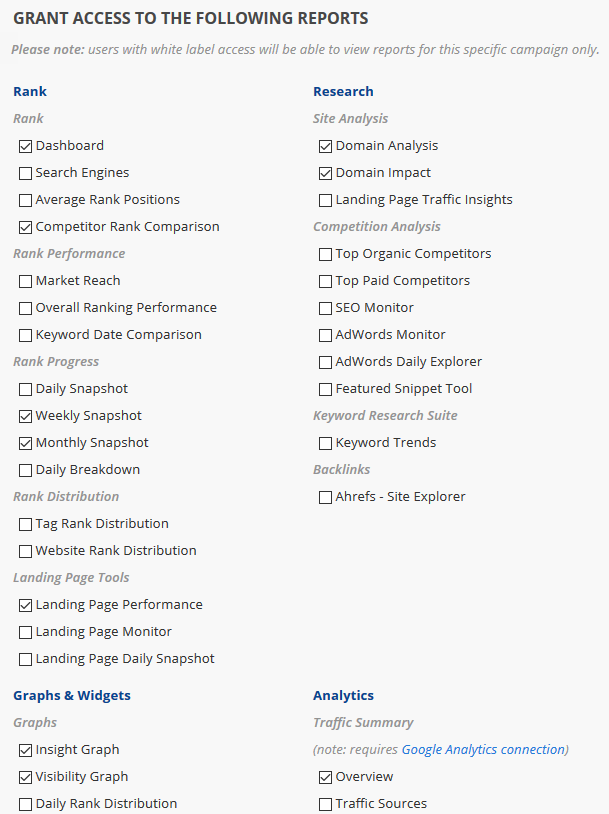
Special Report Options for Client Dashboard View
To create a different report or graph view for display in the Client Dashboard of a specific campaign:
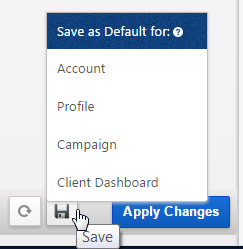
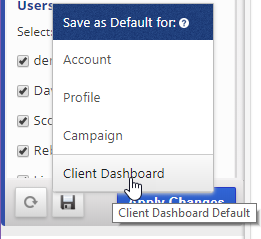
If you want this view to be the same for new campaigns in the future, you can also save it as the Account Default Setting, and then when the new campaign is created, repeat the Save as Default for Client Dashboard step before making changes for your own view.
To create a different report or graph view for display in the Client Dashboard of a specific campaign:
- View the report and expand the Report Options section
- Select the settings you want for your client's view of the report
- Scroll down to the bottom and click the Apply Changes button
- Confirm that the report displays options you expected
- Expand Report Options again
- At the bottom hover over the Save icon and select Save as Default for Client Dashboard
If you want this view to be the same for new campaigns in the future, you can also save it as the Account Default Setting, and then when the new campaign is created, repeat the Save as Default for Client Dashboard step before making changes for your own view.
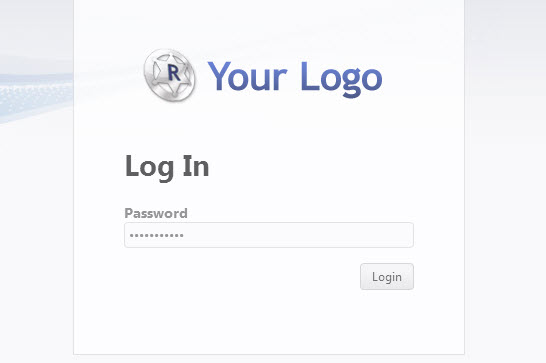
If using Secure White Label Password-protected URL:
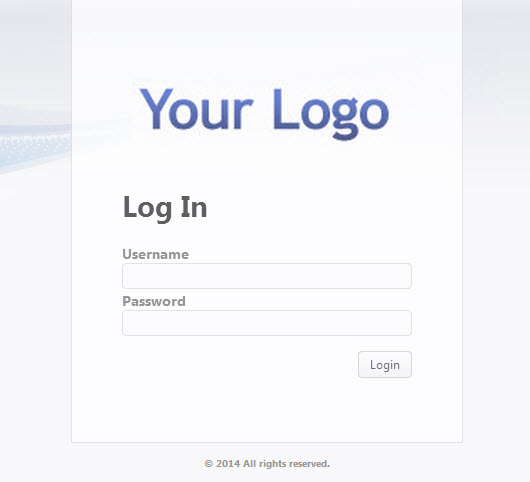
If using Custom Domain Service:
Your White Label Client Dashboard displays as your client(s) will view it.
- Copy and paste the URL from the Secure White Label Portal Access area of the Campaign Settings > White Label Client Dashboard screen and enter it into the address bar of your browser.
- Enter the password you created for the specific campaign and click the Login button.
If using Custom Domain Service:
- Enter your Custom Domain URL into the address bar of your browser.
- Enter the username and password you created for the specific campaign and click the Login button.
Your White Label Client Dashboard displays as your client(s) will view it.
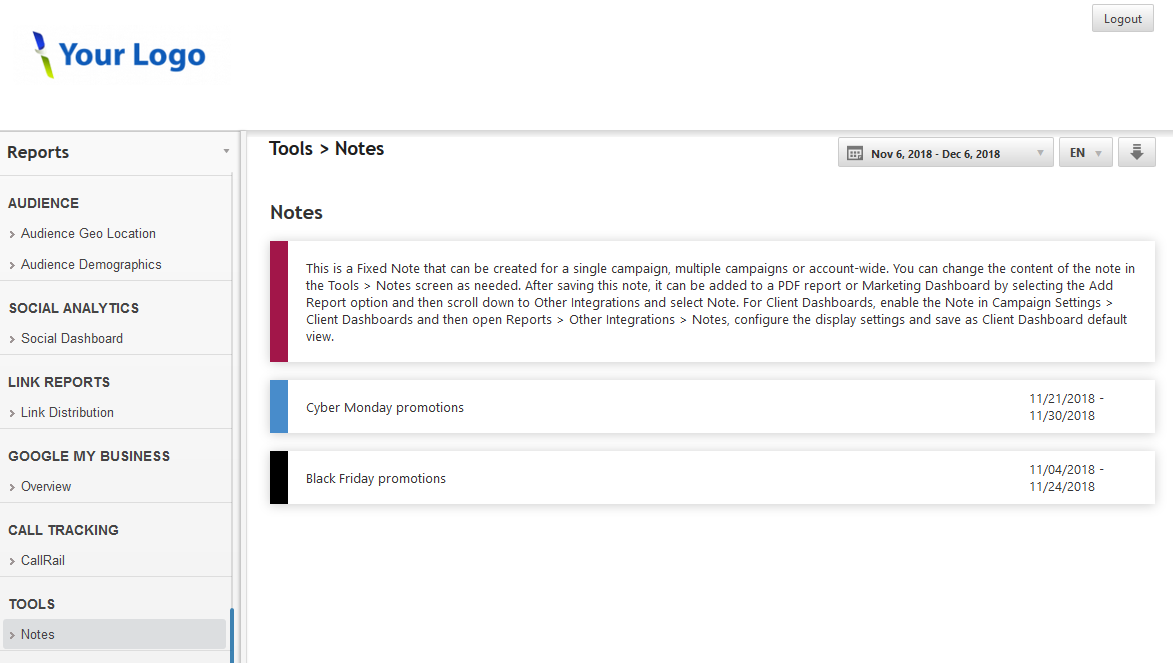
Display Notes Report in Client Dashboards
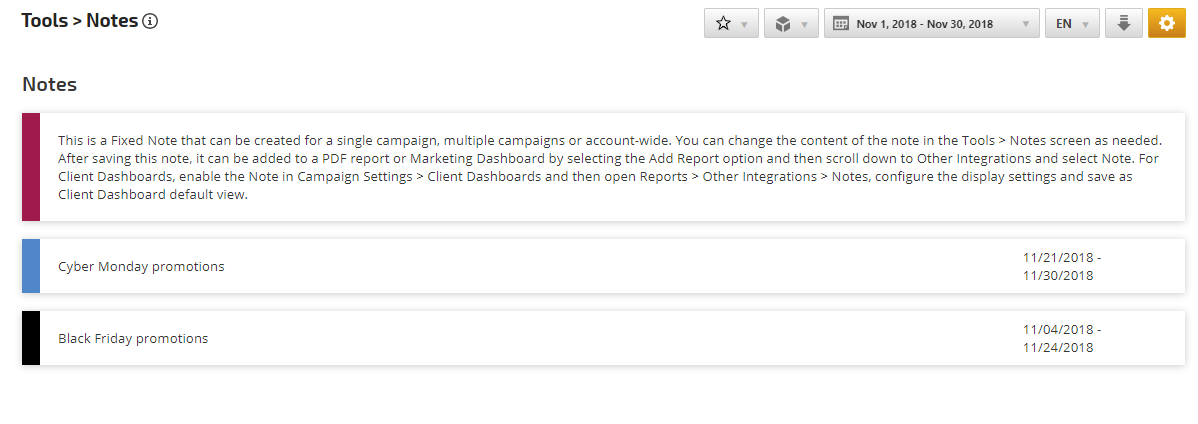
There are 3 types of Notes that can be displayed in Client Dashboards: Single Date and Date Range display text in a PDF based on the report date setting. Fixed notes can be used to display a message for a single campaign, specific multiple campaigns or account-wide continuously and the content can be changed as needed (in the Campaigns > Toolkit > Notes screen).
Click the Apply Changes button
Follow the Client Dashboard Settings instructions to enable the view of Notes in your Client Dashboard.
Notes displayed in a Client Dashboard
Add Note to Client Dashboard
After creating a Note (in the Campaigns > Toolkit > Notes screen), access Reports & Tools > Custom Suite > and select Notes Report in the main left menu.
Expand Report Options and configure the Notes settings.
For on-screen viewing, you may select a date range (this setting does not apply to the Client Dashboard, which is based on the dashboard date selection).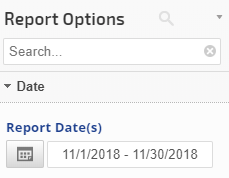
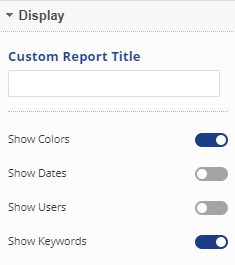
Display Settings
Select the options that you want displayed:
Select the options that you want displayed:
- Custom Report Title (optional): enter text that you want displayed at the top of the Notes list
- Show Colors: if selected, then a color border will display to the left of the note
- Show Dates: if dates are associated with the note and you want that displayed, then enable this option
- Show Users: if you want the name of the person who created the note to be displayed, then enable this option
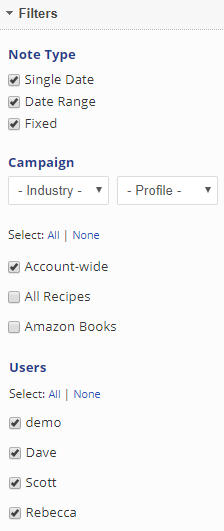
Filters
- Select the Type of Note(s) you want displayed in the dashboard
- Single Date displays text for one date on a graph hover or in reports that support this feature
- Date Range displays text across a date range on a graph or in reports that support this feature
- Fixed can be used to display a message for a single campaign, specific multiple campaigns or account-wide continuously. This note type is not limited to specific date(s), it can be set to display in white label marketing dashboards, client dashboards and PDF reports, and then the content can be changed as needed, in the Campaigns > Toolkit > Notes screen.
- Select the Campaign(s) for which Notes were created that you want displayed in this dashboard (e.g., if this is a corporate dashboard that summarizes 10 branches of the company, you might select all of the campaigns that are associated with it).
- Select the Users who created Notes that you want displayed in this dashboard
Click the Apply Changes button
Save Settings as Client Dashboard Default
After saving your settings, hover over the Save icon and click Client Dashboard to save the settings as the Client Dashboard default.
After saving your settings, hover over the Save icon and click Client Dashboard to save the settings as the Client Dashboard default.
Follow the Client Dashboard Settings instructions to enable the view of Notes in your Client Dashboard.
Reports & Tools > Custom Suit > Notes Report
After saving your Notes settings, they display in the user interface
After saving your Notes settings, they display in the user interface
Client Dashboards vs. Marketing Dashboards
All reporting platform plans are equipped with our original Client Dashboards. This online dashboard mirrors the Rank Ranger Platform layout to the extent of the reports you choose to include, and permissions you establish for each client.
The Marketing Dashboard, originally a premium feature is now also included in reporting platform plans. It provides a website style framework that is customizable with access to HTML and CSS. Additional features include a built-in dashboard navigation menu for web pages and external links, page elements that can be sized to 1/2 or full screen width for the report, graph, and text box layout flexibility, a WYSIWYG text editor for static or scheduled messages, and embedding of files and images, templates, and support for multiple versions of the same reports and graphs.
| Feature | Client Dashboard |
Marketing Dashboard |
| Design | Mirrors the Rank Ranger platform based on the reports and permissions enabled for client view |
Website style framework with fully customizable HTML and CSS. Page elements can be sized to 1/2 or
|
| White Label Logo |
1: choice of your company logo or your client's logo |
2: choice of one or both your company logo and client's logo |
| Client Access URL |
Login credentials or public URL |
Login credentials or public URL |
| Use your domain URL |
Custom Domain, add-on option |
Custom Domain, add-on option |
| Multiple campaign Single Sign-on |
Yes, Profiles can be used to group multiple campaigns for viewing with a single login to a dashboard |
Yes, Profiles can be used to group multiple campaigns for viewing with a single
|
| Reports & Graphs |
1 of each Rank Ranger report and graph |
You can add multiple versions of the same report or graph, and organize them in web pages with titles displayed in the navigation menu. |
| Cross-campaign Reports & Graphs |
No, each Client Dashboard presents report data for
|
Yes, Marketing Dashboards can contain data for any campaign in the account. For example, it is possible to create a dashboard with data from a campaign for a website, and separate campaigns for the YouTube and the App Store affiliated with the website. |
| Text boxes |
Not available |
Text boxes can be used to display messages to clients and can be scheduled to display during specific time periods or constantly. They can display before, after, or beside reports and graphs. |
| Embed External Data |
Not available |
Embed Images, Google Spreadsheets, Presentations, Drawings, and Forms as well as Vimeo and YouTube videos |
| Templates | No, however, you can set an account level default for the reports and graphs you
|
Yes, you can select from a variety of built-in design templates, launch one of our templates and edit it to fit your needs, or create and save your own design and content templates that can be applied to other campaigns. |
Demo Dashboards
|
Client Dashboard example Experience a live Client Dashboard with multiple campaign single-sign on feature, that uses a Public URL access (no password required) |
Marketing Dashboard example Experience a live Marketing Dashboard demo with a single sign-on feature, that uses secure login access (password: demo) 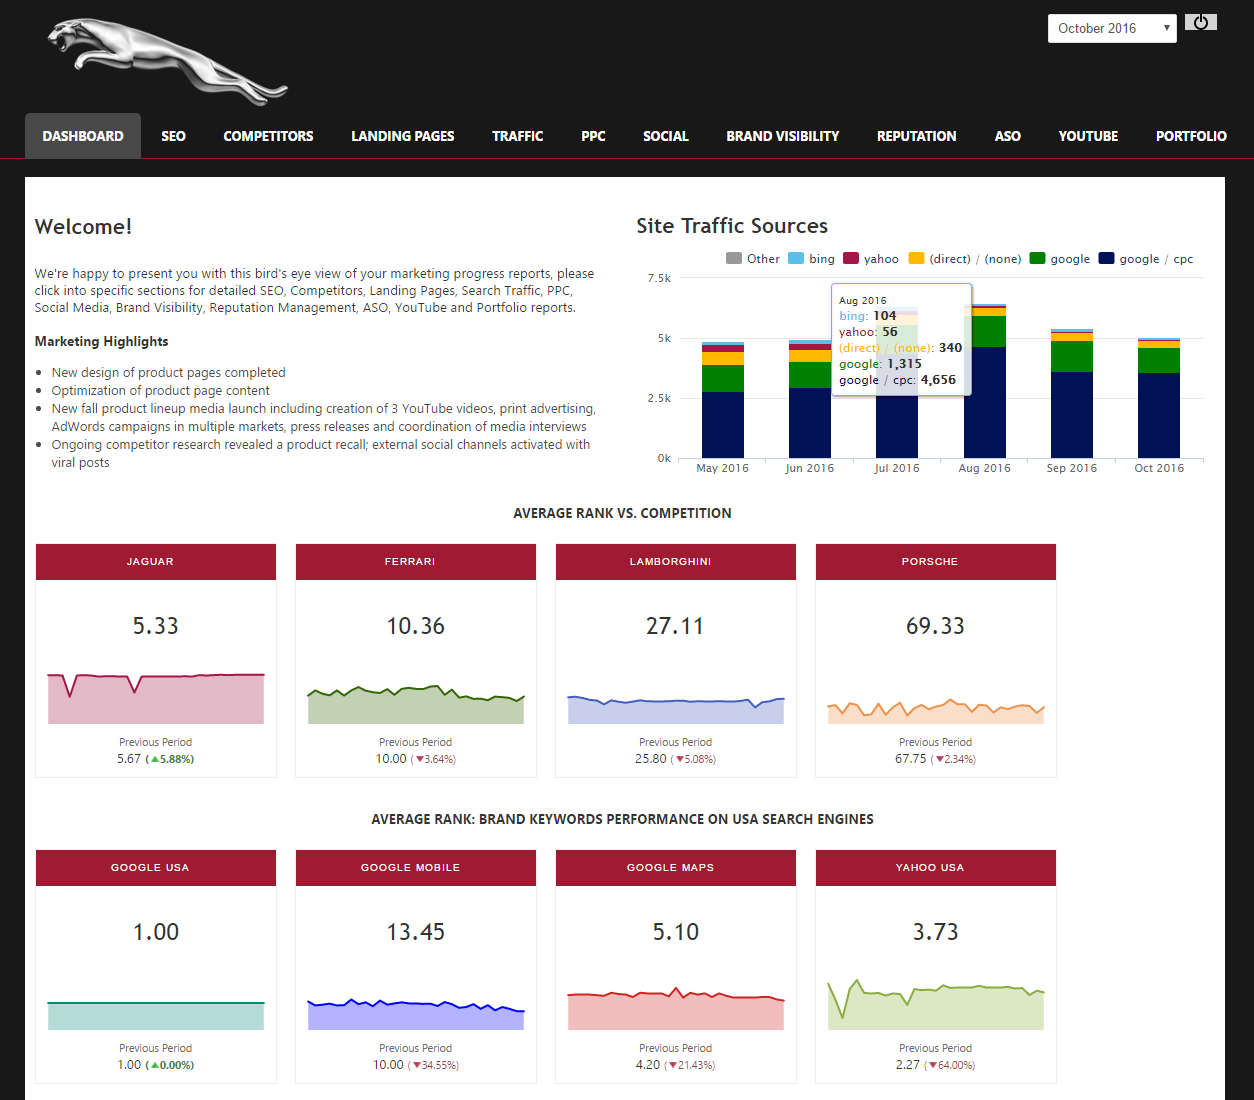 |
Marketing Dashboards are a premium feature that can be subscribed to in stand-alone marketing dashboard plans or added to full reporting platform plans. If your current plan does not support Marketing Dashboards and you would like to take advantage of this game-changing feature, please log into your account and complete the Build Your Own Scalable Package form at the bottom of the Add New Package screen and we'll be happy to provide you with pricing and build a custom plan that meets your current requirements and is expandable for future growth.