The Facebook Insights Overview report provides a synopsis of the overall performance of a Facebook Page. Social marketing metrics such as People Engaged, Page Fans, Page Impressions, Total Reach, Page Stories, Post Clicks, Likes, Video Views, and more are displayed in a variety of trend graphs and numeric elements.
Important! In order to view this report, you must authorize a connection to a Facebook account that has Admin permissions for a Facebook Page.
Facebook limits the amount of data available via their API to 90 days. We follow Facebook's best practices in order to provide the reporting that they allow. We review third-party developer API changes monthly, so if they change the rules to allow for a longer reporting period, we'll update our reports accordingly.
- SEO
- Rank Tracker
- Local SEO
- Mobile SEO
- Link Manager
- Landing Pages
- Social Signals
- On-Page Optimization
- Enterprise SEO Solutions
- Marketing
- Competition Analysis
- Insight Graph
- Keyword Research
- Graphs & Widgets
- Market Reach
- Marketing KPI
- Brand Visibility
- White Label SEO
- Marketing Dashboard
- Client Dashboard
- PDF Reports
- PDF Templates
- Other
- Email Notifications
- Portfolio Management
- Integrations
- Google Analytics
- Search Console
- Pay Per Click
- WeDevelop
- API
Facebook Insights Overview
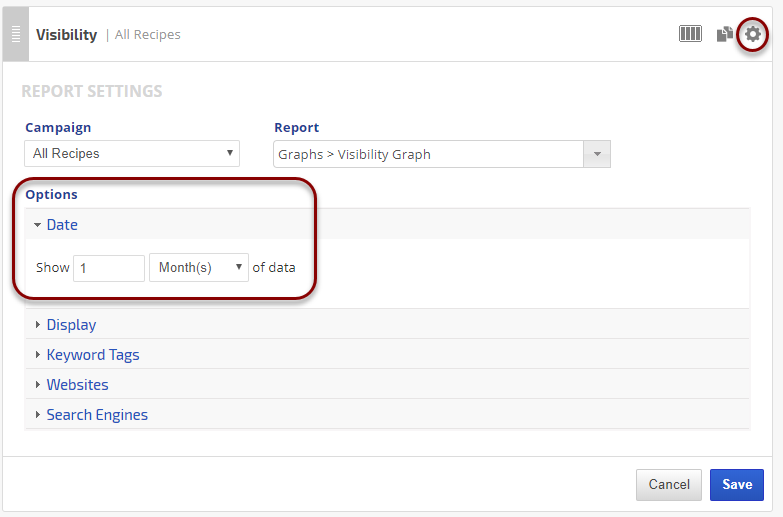
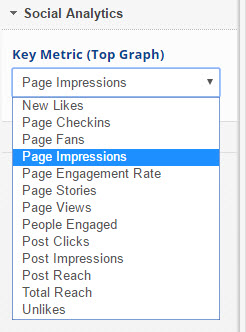
The Facebook Insights graph affords a visual of Facebook Page performance on a per metric basis. The data shown within the graph can be set to display for a custom time period and can reflect previous period data on the same axis (Report Options > Date settings).
 Select any of the following metrics to display in the graph:
- New Likes
- Page Fans
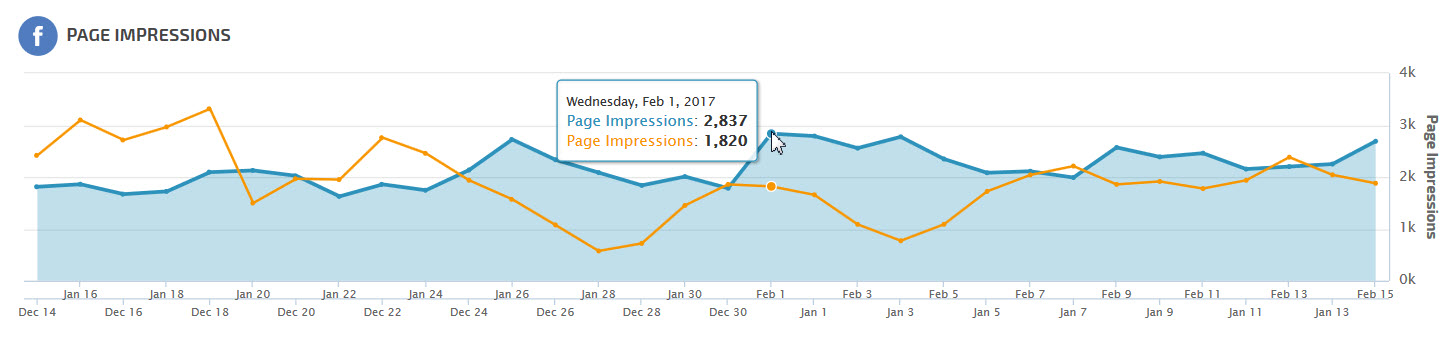
- Page Impressions
- Page Engagement Rate
- Page Stories
- Page Views
- People Engaged
- Post Clicks
- Post Impressions
- Post Reach
- Total Reach
- Unlikes
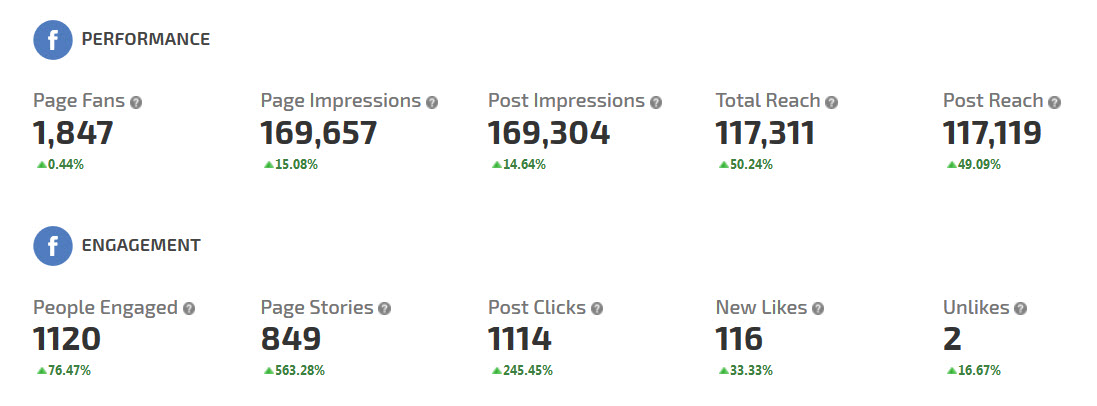
The Overview of Facebook Stats section of the report presents a numeric summary of Facebook Page performance and engagement. The data displayed in this section may also include previous period percentage change statistics that appear under each metric value when the compare to previous period feature is selected in the Report Options Date section.
The data shown includes:
The data shown includes:
- Page Fans (aka Likes): the total number of people who have liked the Page. (Unique Users)
- Page Impressions: the number of impressions seen of any content associated with the Page. (Total Count)
- Post Impressions: the number of impressions resulting from all Page posts. (Total Count)
- Total Reach: the number of people who have seen any content associated with the Page. (Unique Users)
- Post Reach: the number of people who saw any of the Page posts. (Unique Users)
- People Engaged: the number of people who engaged with the Page. Engagement includes any click or story created. (Unique Users)
- Page Stories: the number of stories created about the Page
- Post Clicks: the number of clicks on any of your content. Stories generated without clicks on page content (e.g., liking the page in Timeline) are not included. (Total Count)
- New Likes: the number of new people who have liked the Page
- Unlikes: the number of Unlikes of the Page (e.g., users who previously Liked the page, and later clicked the Unlike this Page option)
The People Talking About This trend graph presents data on the number of people engaging with, and sharing stories about, the page during the selected report period.
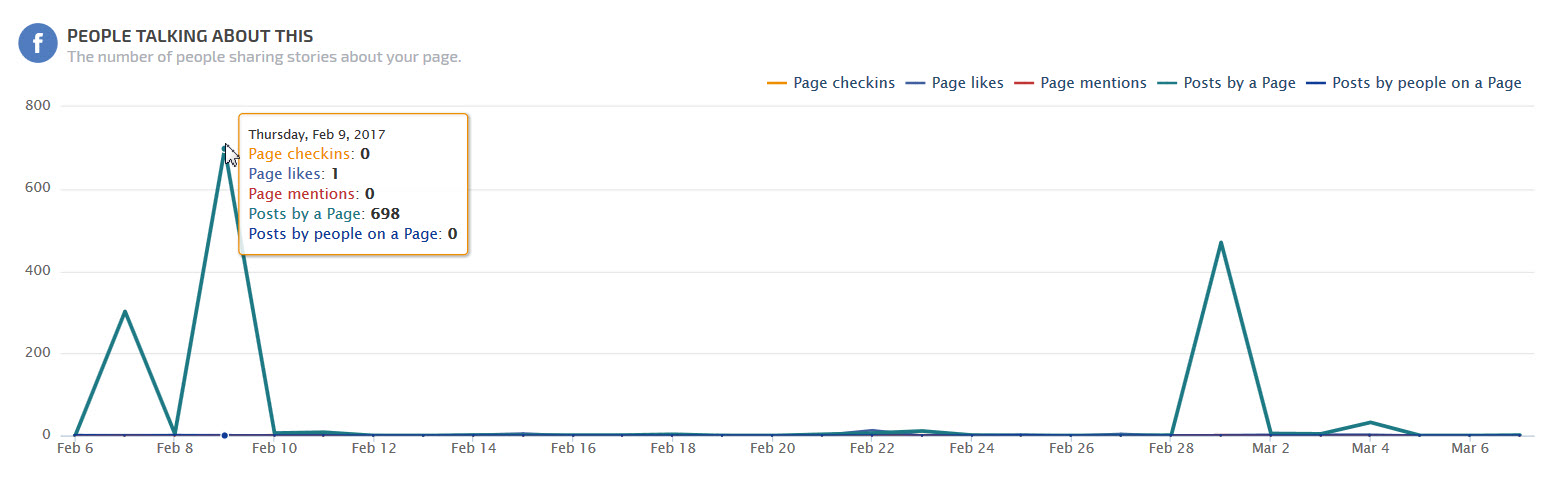
When any of the following occurs relating to a page, this graph displays:
When any of the following occurs relating to a page, this graph displays:
- Page Checkins: the number of times that people have indicated they visited the page's physical location by utilizing the checkin option in a personal post.
- Page Likes (aka Fans): the total number of people who have liked the Page. (Unique Users)
- Page Mentions: the number of mentions of your Page that are attributed to your ads. A mention happens when a person types @ followed by your Page name, then selects your Page name from a list, in a Facebook post or comment.
- Posts by a Page: the number of times content posted by a Facebook Page has been referenced on another page.
- Posts by People on a Page: the number of times that people posted on a page.
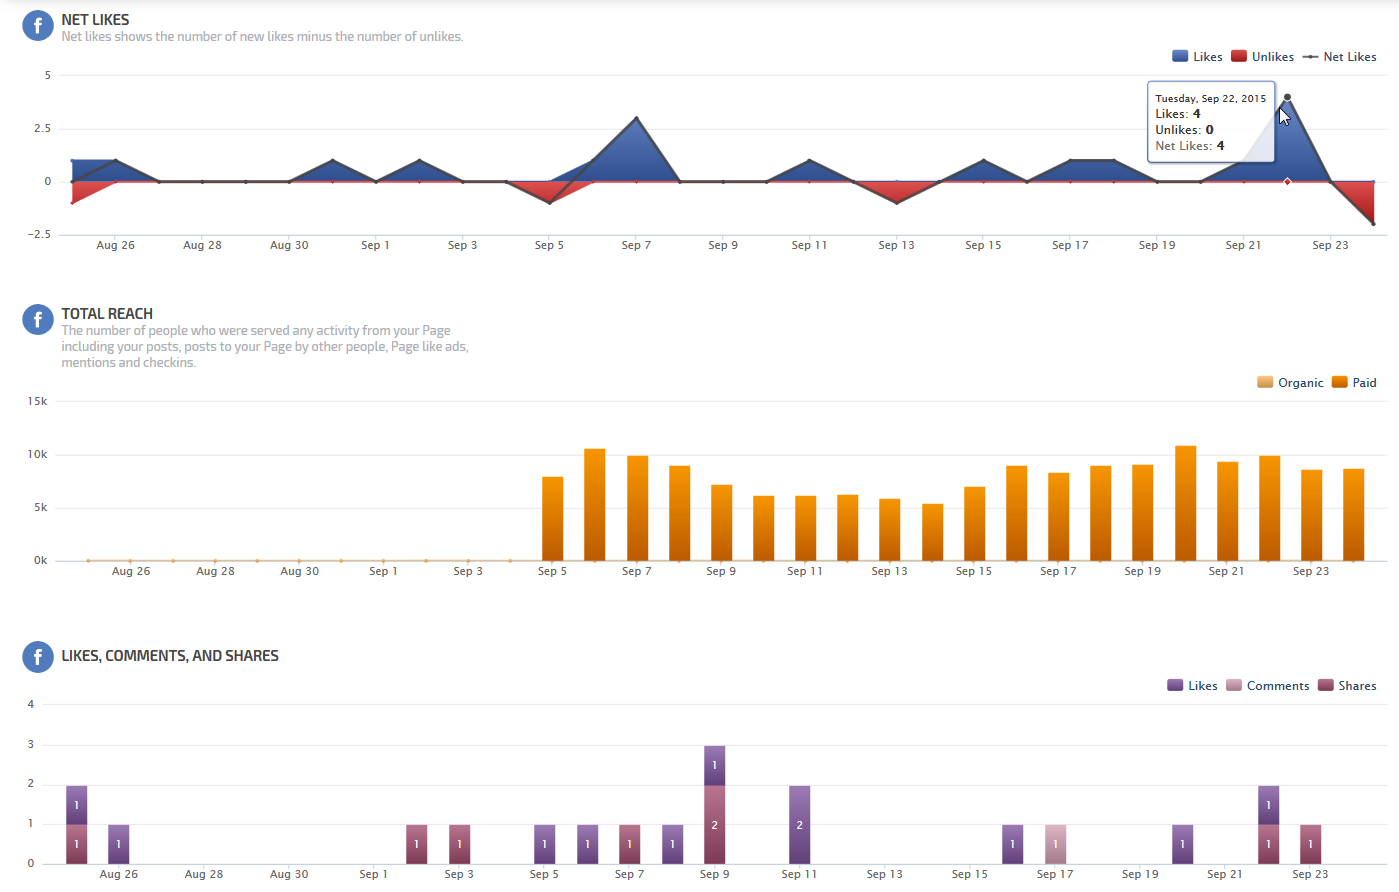
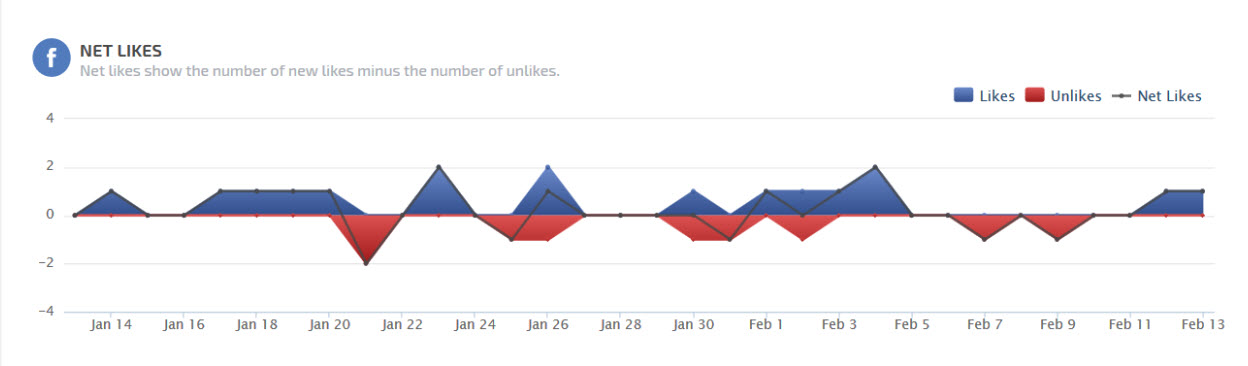
The data on the Net Likes graph presents the Facebook Page's Likes and Unlikes per day in the form of a two metric area graph. Intersecting this data is a line graph that displays the Net Likes of the Page per day, which is calculated by taking the number of likes and subtracting it by the number of unlikes.
Total Reach refers to the total number of people whose Facebook feed has been fed any form of content from the tracked Facebook Page. The scope of this data includes, but is not limited to, posts on the page, posts to the page executed by other users, mentions, and checkins.
The data displayed on the graph is segmented by organic reach (shown as an area graph), and paid reach (shown as columns).
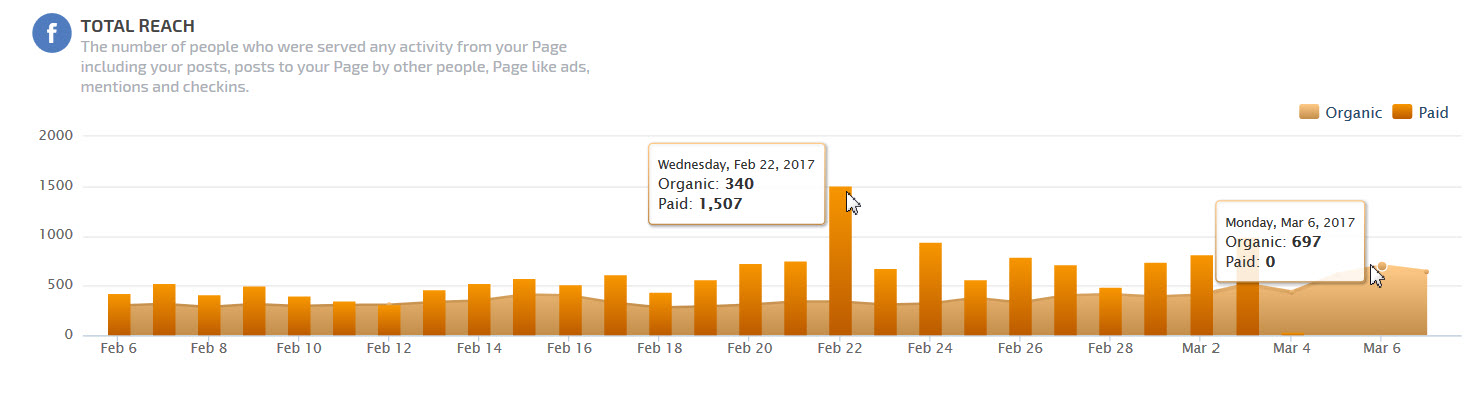
The data displayed on the graph is segmented by organic reach (shown as an area graph), and paid reach (shown as columns).
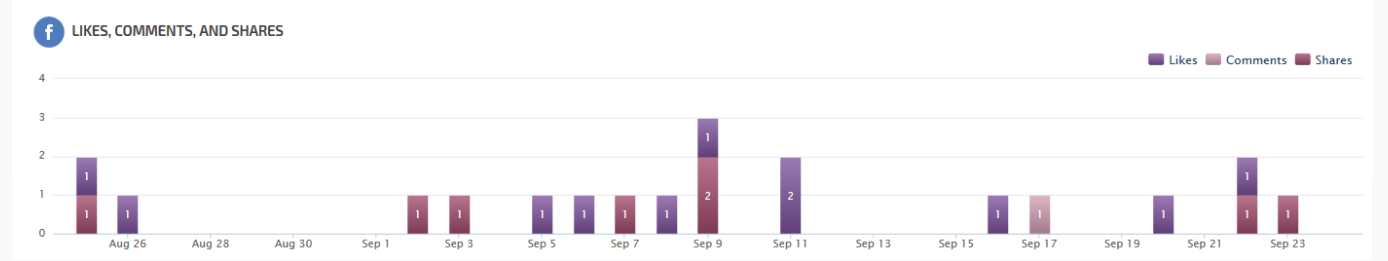
This Facebook engagement graph presents the overall user interaction with the Facebook page content. Displaying daily data over the selected report period, the graph presents via multi-colored stacked columns, the number of likes, comments, and shares that the Page content has received.
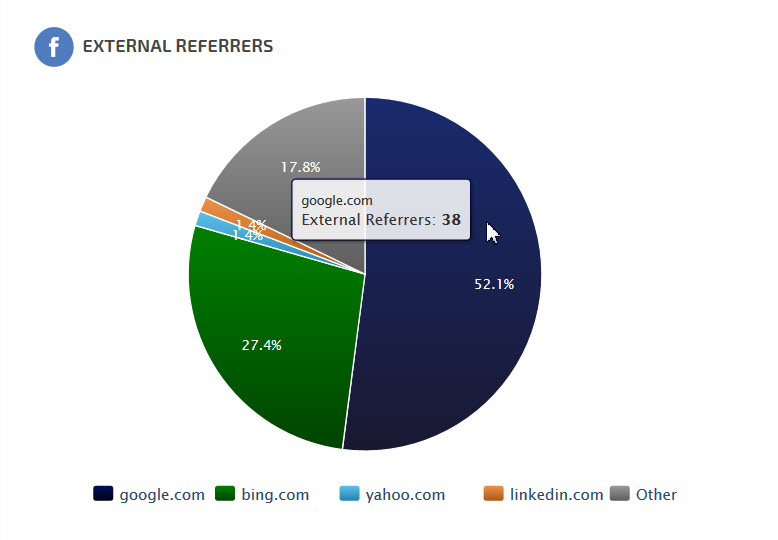
The External Referrers pie chart displays a percentage breakdown of sources that have referred users to the Facebook page during the selected reporting period.
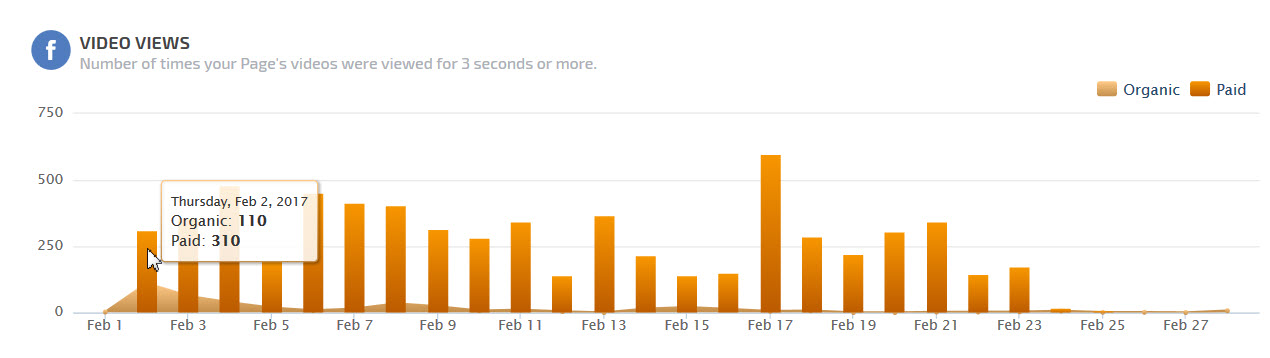
Tracking the number of times video content was viewed on your page, the Video Views Graph segments views by source. For a video to be considered to have been viewed, it must have been played for a period greater than 3 seconds. For such views, the graph indicates whether the viewer was brought to the Facebook page organically, or via a paid promotion.
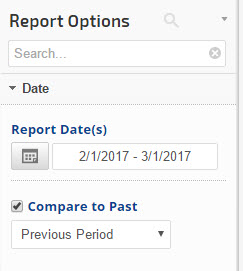 |
Report Dates
|
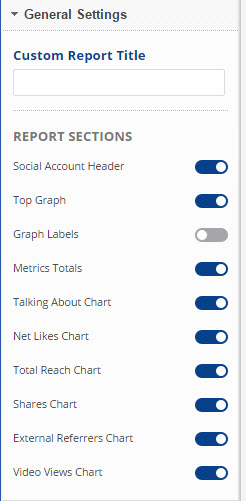 |
General Settings
|
 |
Social Analytics
|
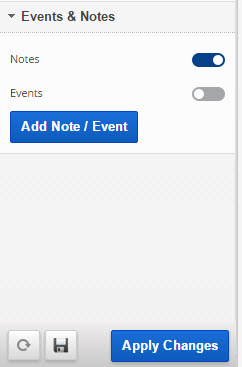 |
Events and Notes
|
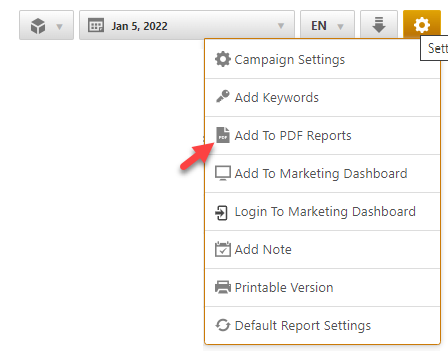
Add to PDF Report
Conveniently add a report or graph with its current settings to a PDF report by hovering over the gold gear icon and selecting Add to PDF Reports
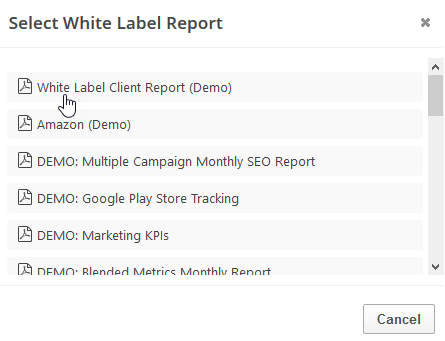
Select the PDF Report that you want the report or graph added to
Drag the new report or graph into the position you want it to display in the PDF and confirm that the Date settings do not conflict with the automated scheduling settings.
Add to Marketing Dashboard
Conveniently add a report or graph with its current settings to a marketing dashboard:
1. Hover over the gold gear icon and select Add to Marketing Dashboard
2. Select the Dashboard (campaign name)
3. Select the Dashboard Page that you want the report added to

1. Hover over the gold gear icon and select Add to Marketing Dashboard
2. Select the Dashboard (campaign name)
3. Select the Dashboard Page that you want the report added to
4. Click the "Go to Dashboard" link to further customize the report (e.g., drag it to a specific position on the page, change date settings, etc.)

Refer to the Report Options section for details regarding the display settings, filters and sort options available for this report.
The report date (or date range) is governed by the selected Dashboard date option: Date Selection or Fixed Periods, learn more...
- Daily reports default to the last day of the selected period
- Weekly and monthly reports default to 1 month of data