SEO
Rank Ranger Rank
- Average Rank
- Keyword Rank
- Keyword Position Stats
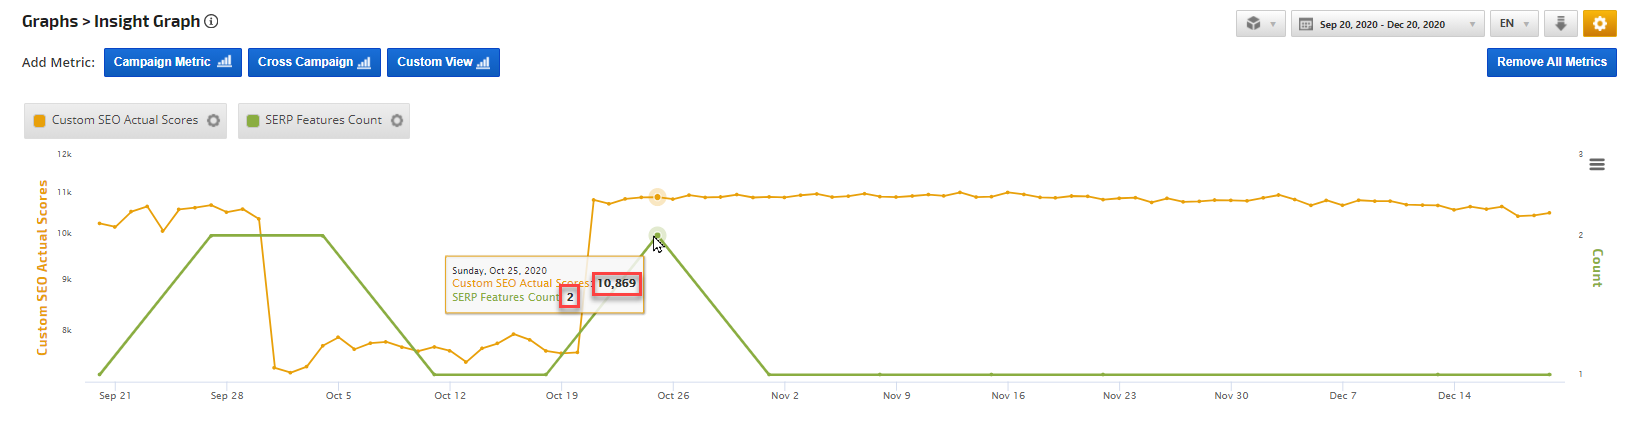
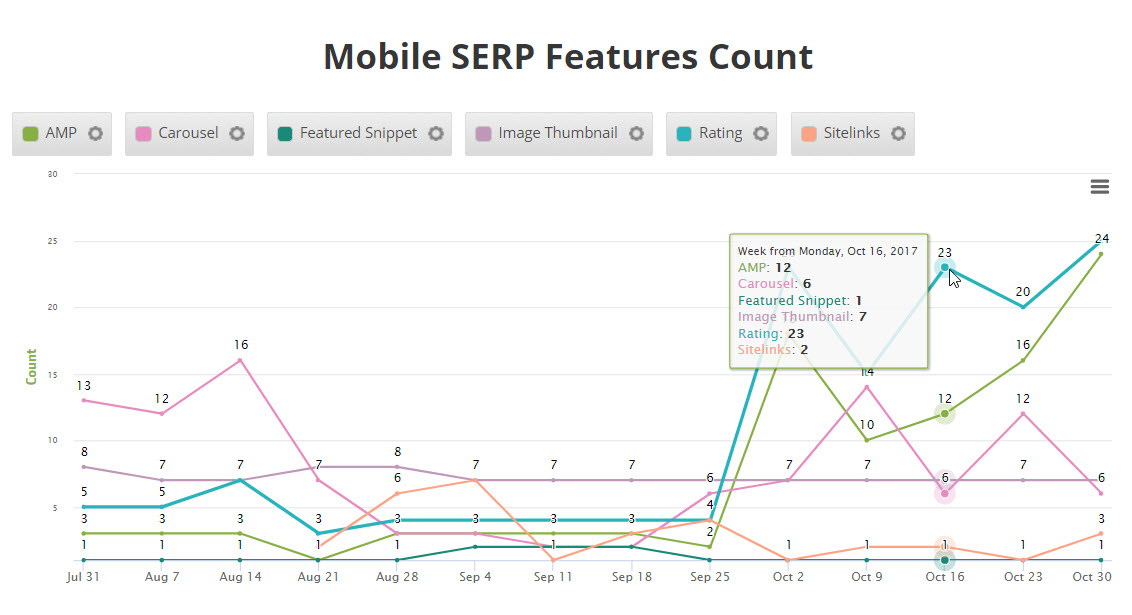
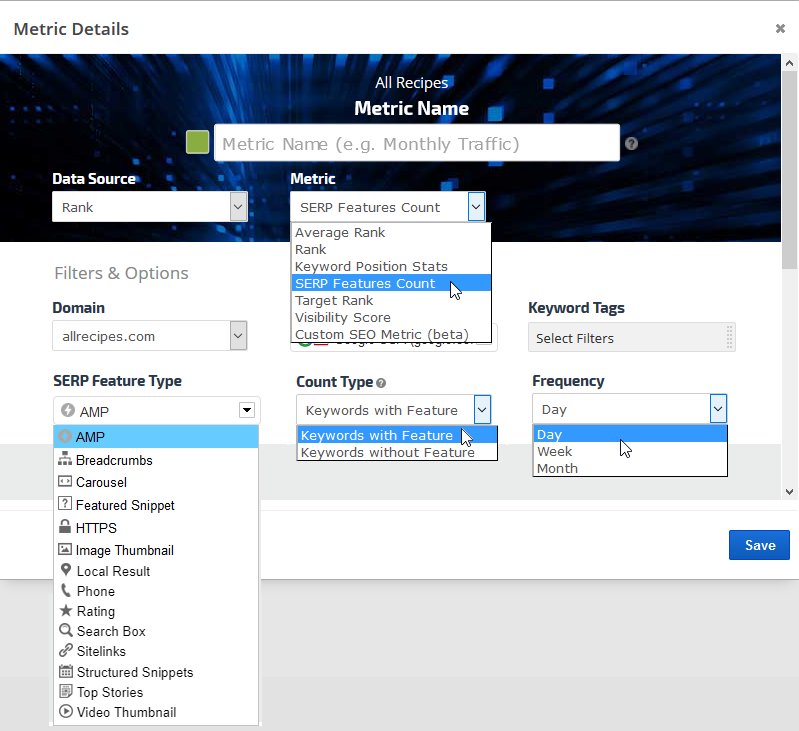
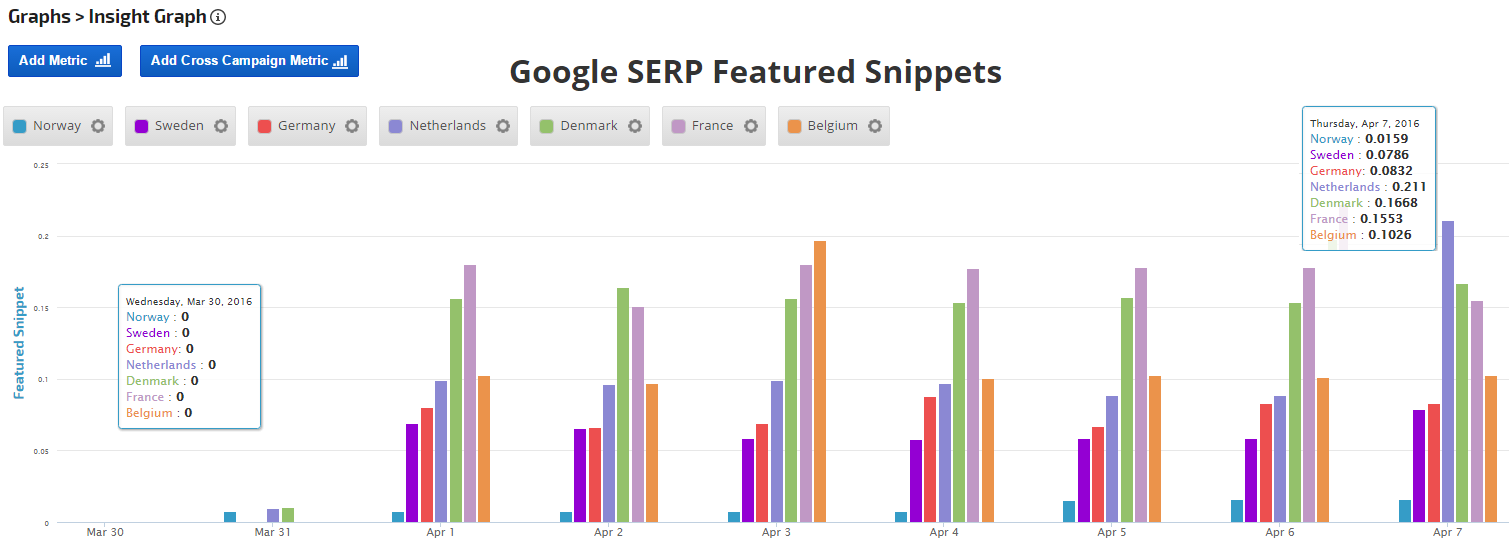
- SERP Features Count
- Target Rank
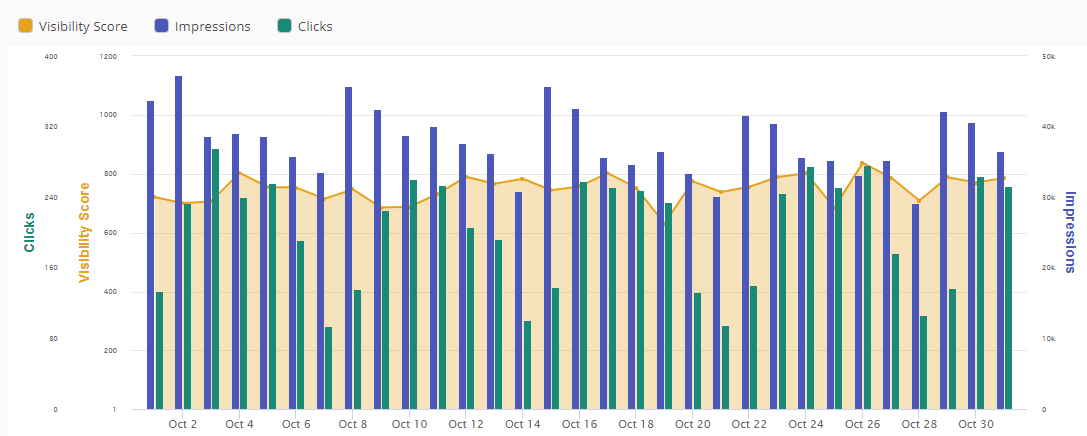
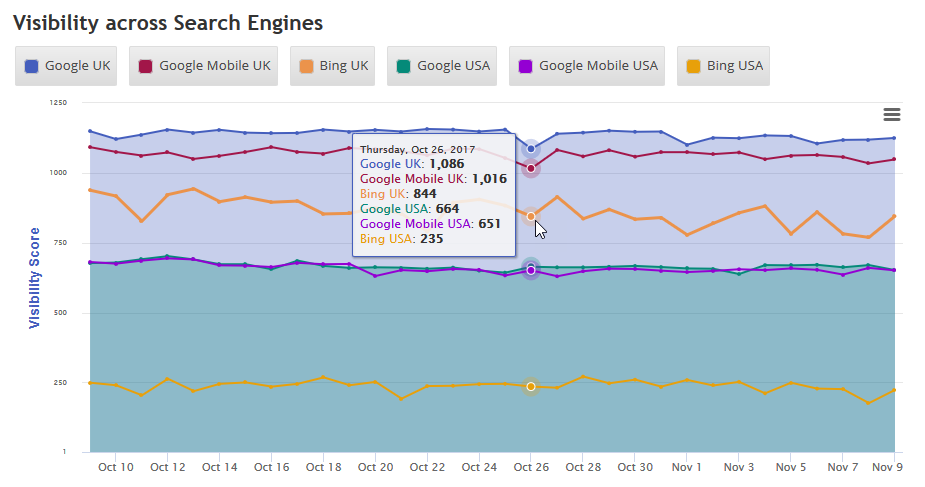
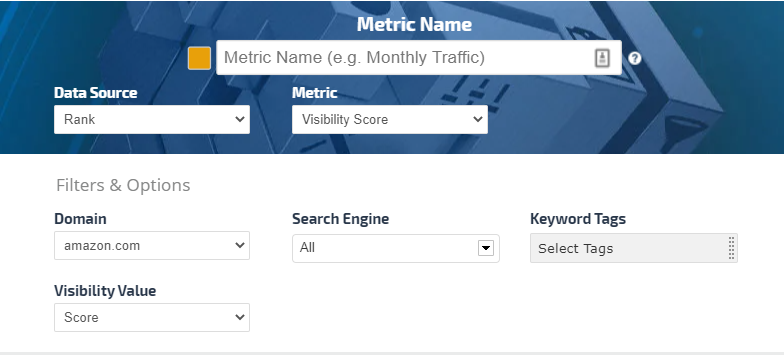
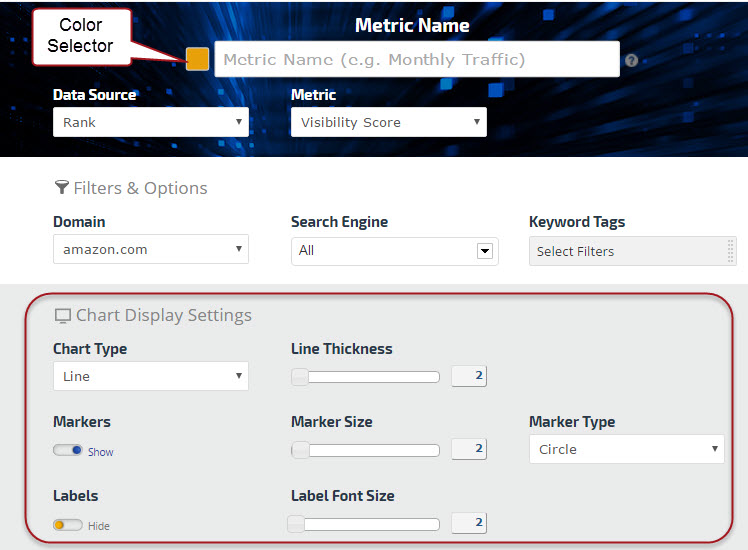
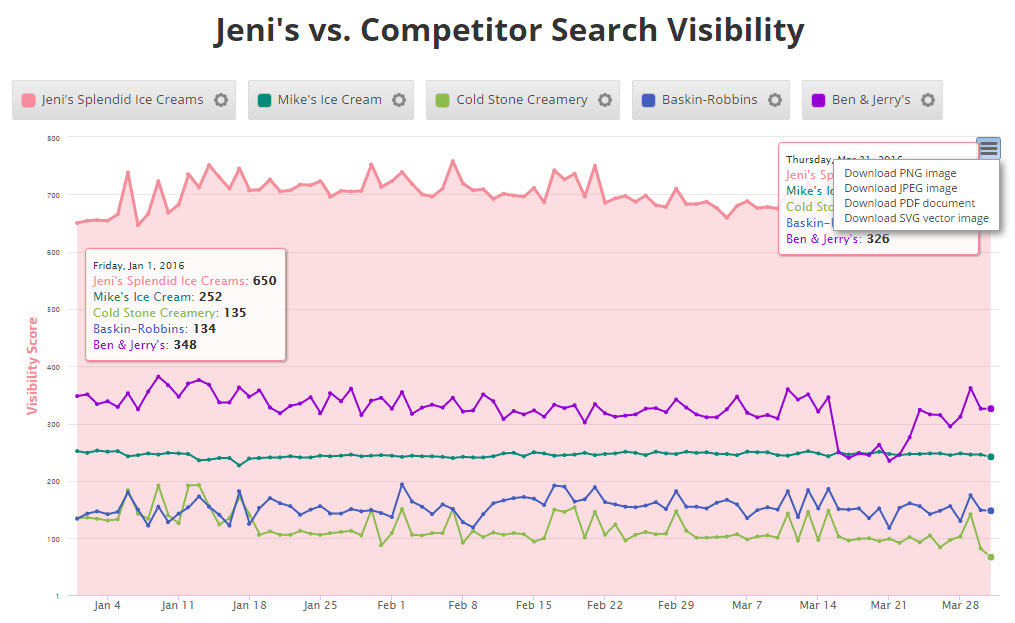
- Visibility Score
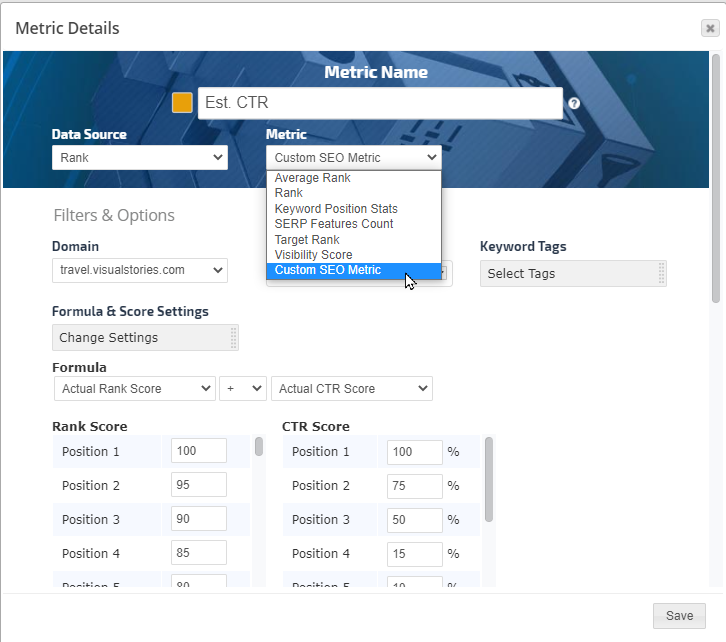
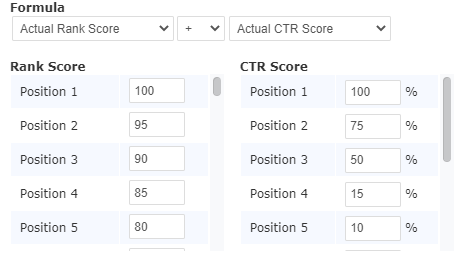
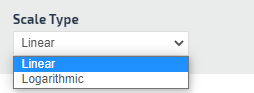
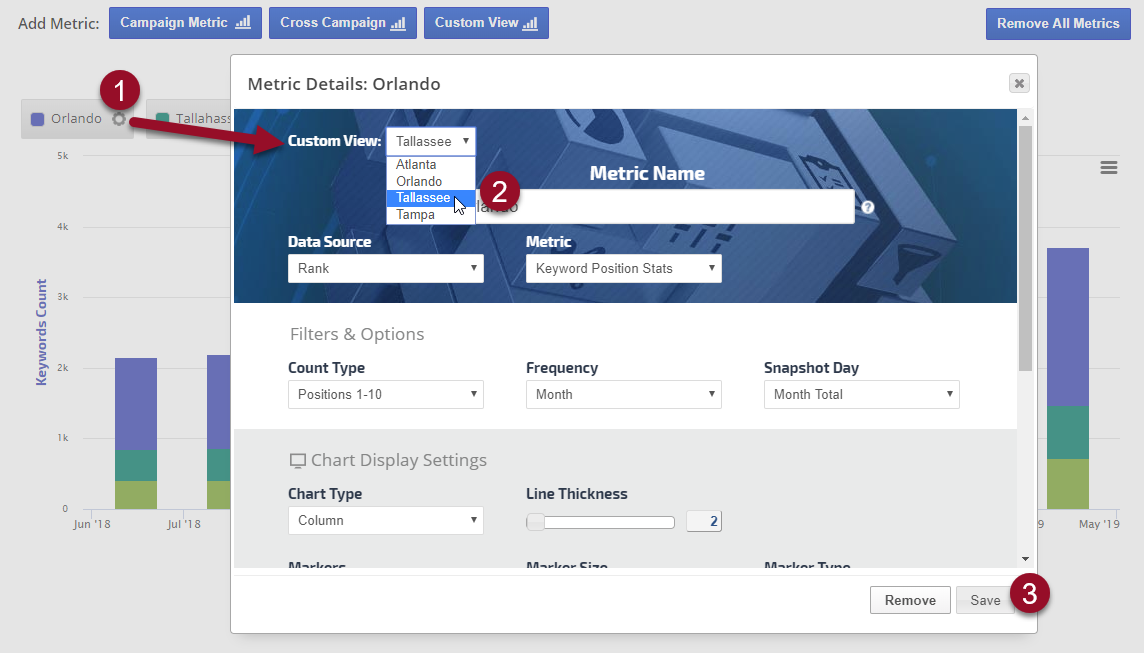
- Custom SEO Metric
Rank Ranger Link Manager
- New Links (based on Create Date)
- New Links (based on Start Date)
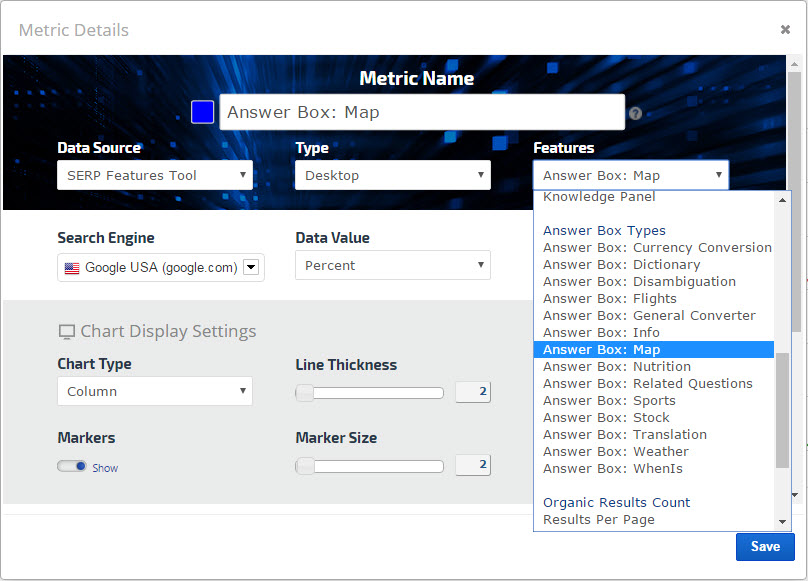
Rank Ranger SERP Features Tool (available in Enterprise packages)
Google Desktop SERP Features Tool
- Organic Indicators:
Breadcrumbs, Events, FAQ/How-to Snippets, HTTPS, Image Thumbnail, Podcast Snippet, Reviews
(Stars), SiteLinks, SiteLinks (1st Result), Search Box, Structured Snippets, Twitter feed,
and Video Thumbnail
- Knowledge Graph Features: Carousels (Black), Carousels (White), Direct Answers, Explore Panel, Featured Snippe, Knowledge Panel, Top Box
- Direct Answer Types: Currency Conversion, Dictionary, Disambiguation, Flights, Info, Nutrition, Related Questions, Sports,
Stock, Translation, Weather, and WhenIs
- Page One Extras: Ads and ad positions, Discover More Places (Box), Hotels Pack, Images (Box), Jobs (Box), Local Pack, News (Box), Things to do/Top Sites (Box), Top Stories (Box), Videos (Box), Related Search, Shopping (Paid)
- Organic Results Count: Description Length, Home Page Results, Landing Page Results, Title Length
Google Mobile SERP Features Tool
- Organic Indicators: AMP, Breadcrumbs, Carousel, FAQ/How-To Snippets, HTTPS, Image Thumbnail, Mobile Friendly, Phone, Podcast Snippet, Reviews
(Stars), SiteLinks, SiteLinks (1st Result), Search Box, Structured Snippets, Twitter feed,
and Video Thumbnail
- Accelerated Mobile Pages (AMP): All queries, News queries
- App Box (All), App Box (Single), and App Box (Pack)
- Page One Extras: Ads and ad positions, Discover More Places (Box), Hotels (Pack), Images (Box), Jobs (Box, Local Pack, Related Search, Rich Cards, Shopping (Paid), Things to do / Top Sights (Box), Top Stories
- Knowledge Graph Features: Direct Answers, Featured Snippet, Knowledge Panels. Top Box
- Direct Answer Types: Dictionary, Disambiguation, Info, Nutrition, Related Questions, Sports,
Stock, Translation, and Weather
- Organic Results Count: Description Length, Home Page Results, Landing Page Results, and Title Length
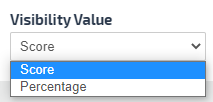
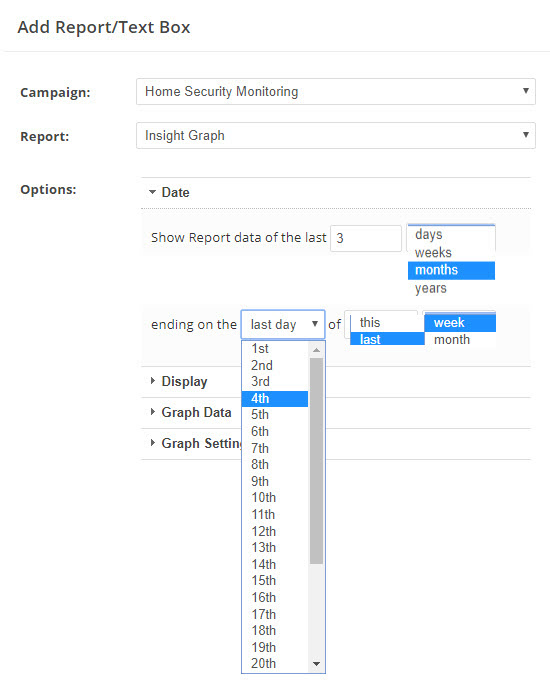
Certain SERP metrics also have options to display data either by the average number of occurrences per page or as a percentage.
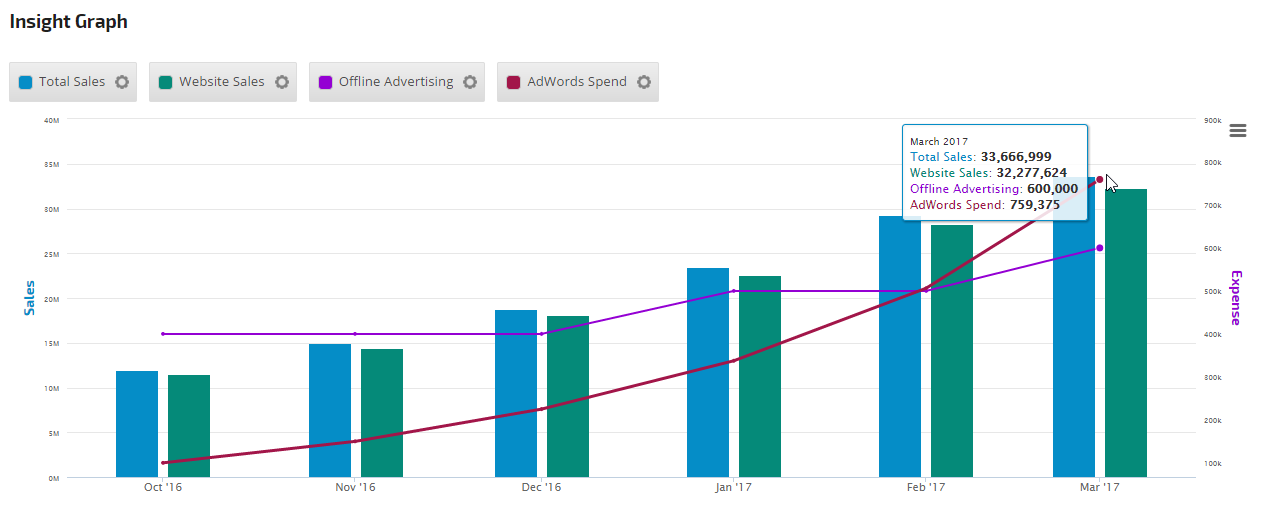
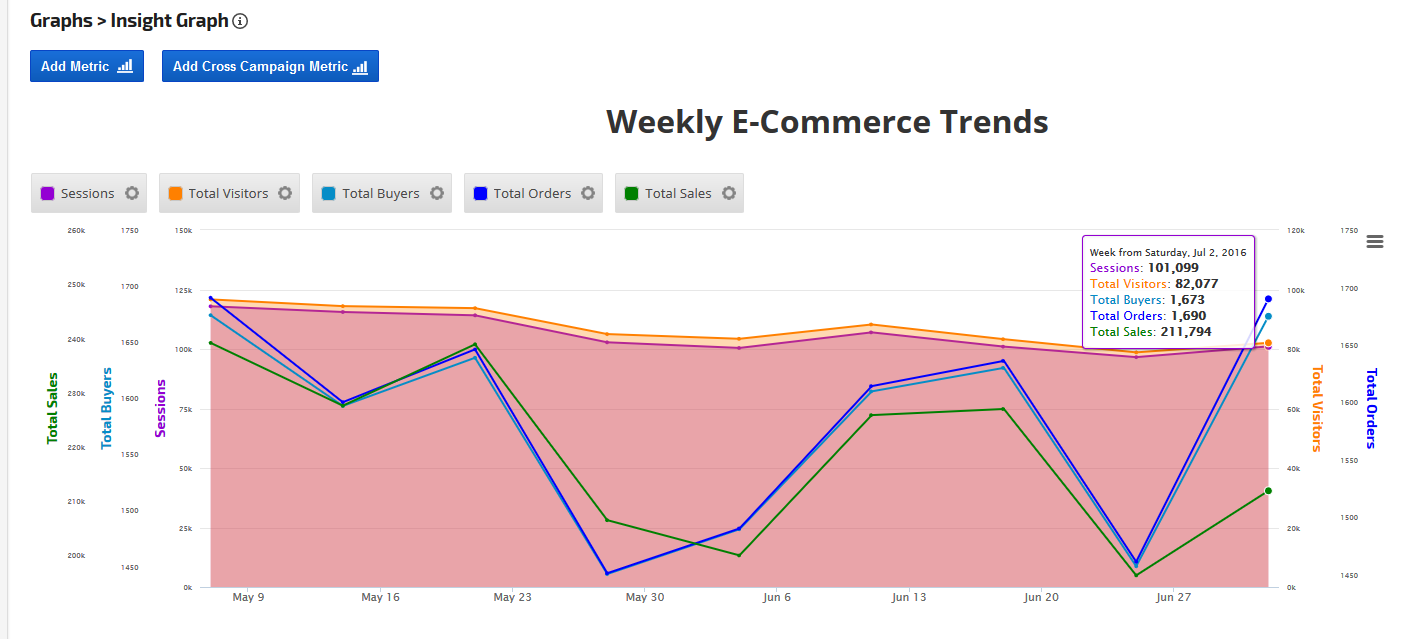
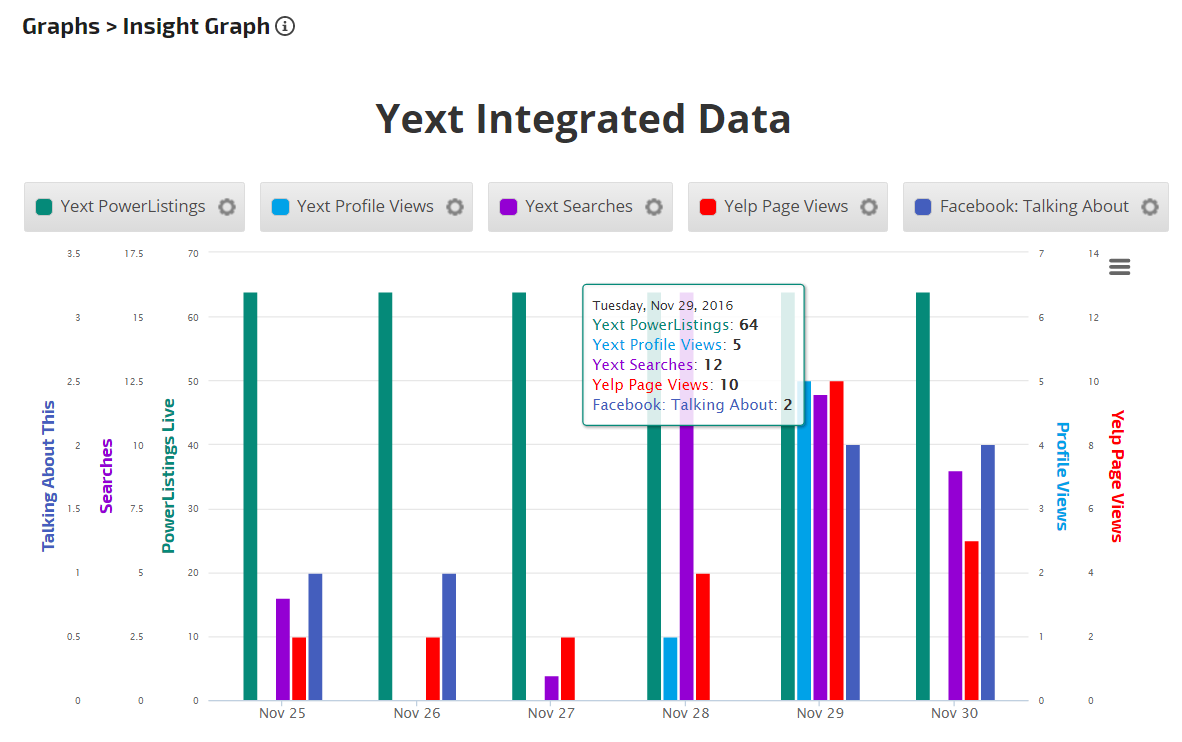
Integrated Performance Metrics
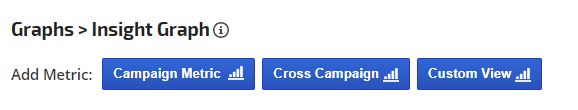
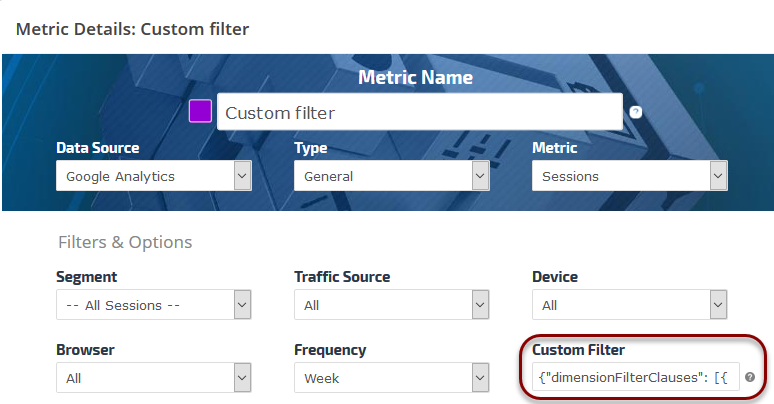
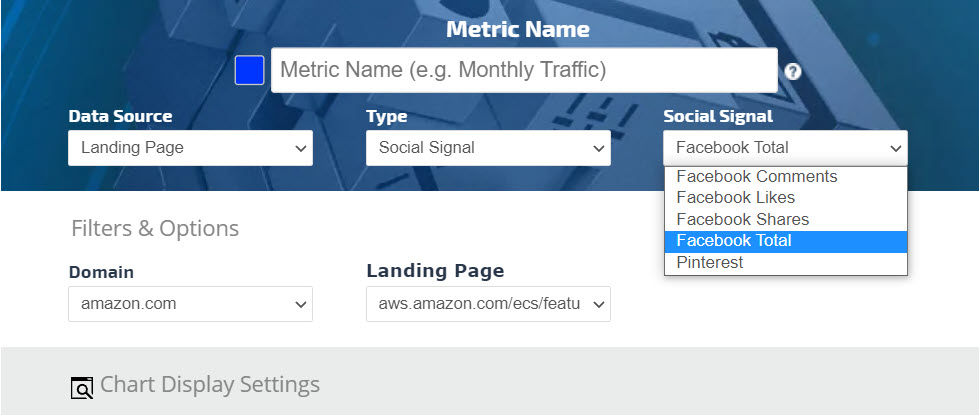
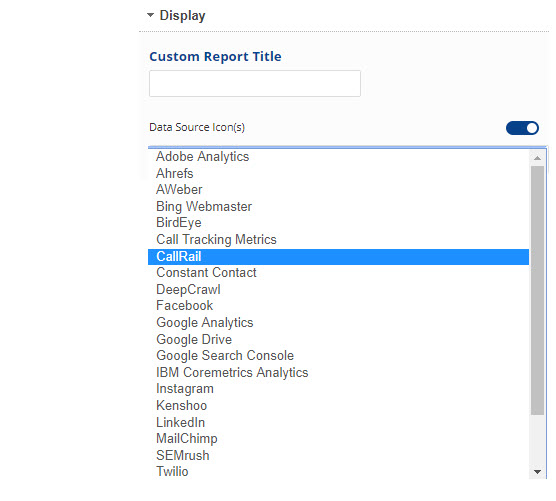
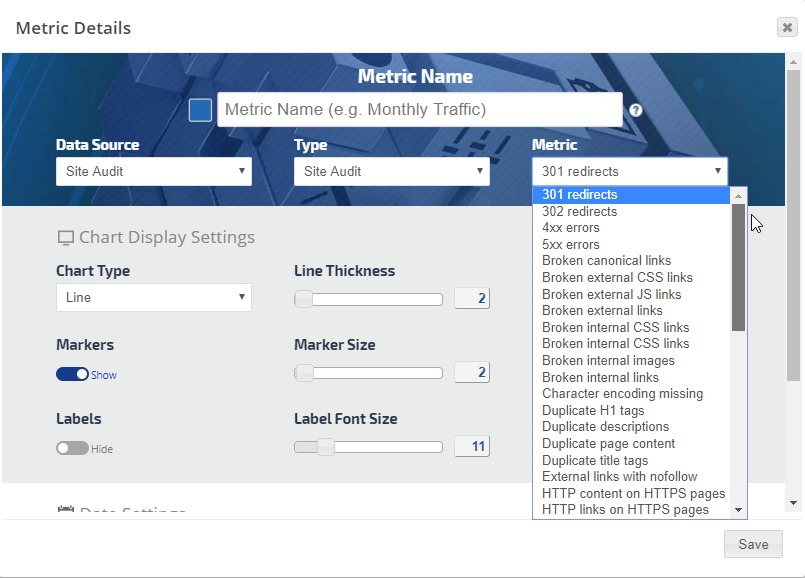
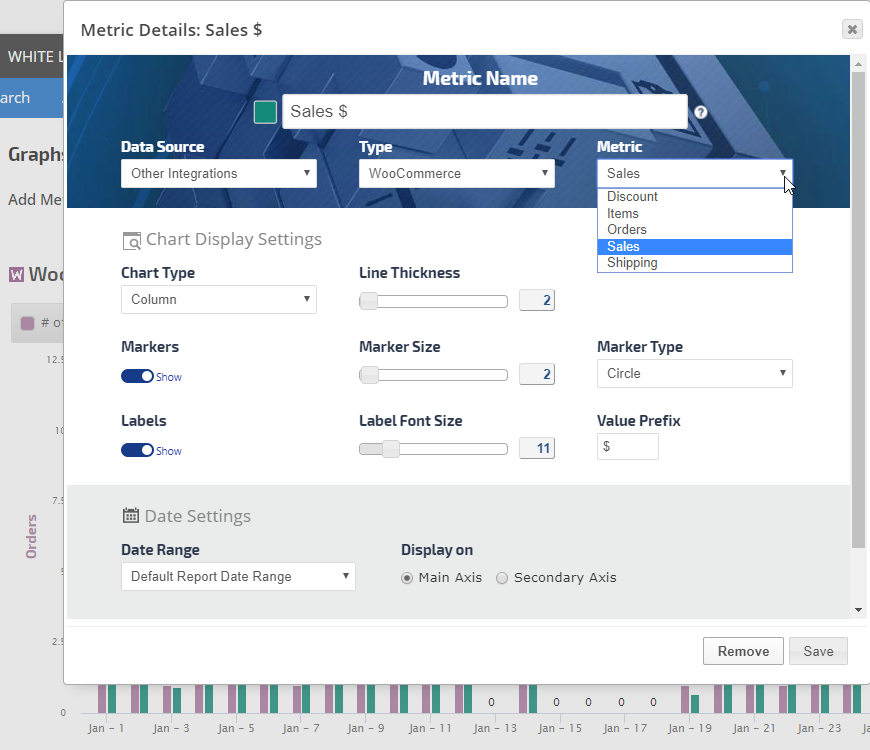
Authorizing third-party integrations expands your options from rank and link data to a wide variety of metrics that you can include in your Insight Graphs and Single Metric Widgets.
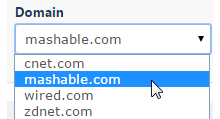
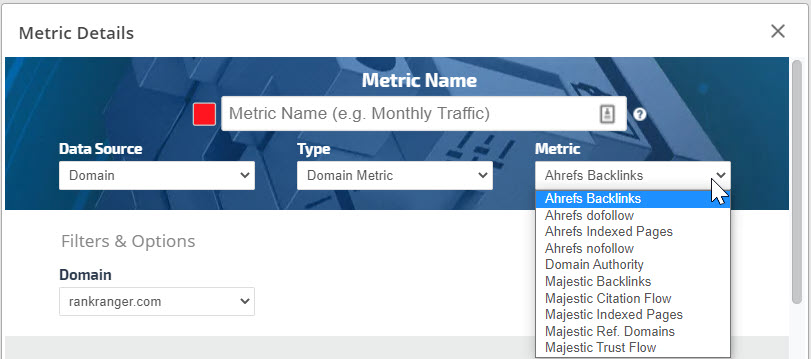
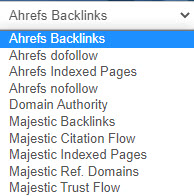
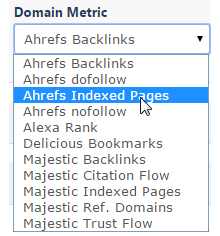
Domain
- Ahrefs Backlinks
- Ahrefs dofollow
- Ahrefs Indexed Pages
- Ahrefs nofollow
- Alexa Rank
- Domain Authority
- Majestic Backlinks
- Majestic Citation Flow
- Majestic Indexed Pages
- Magestic Referring Domains
- Majestic Trust Flow
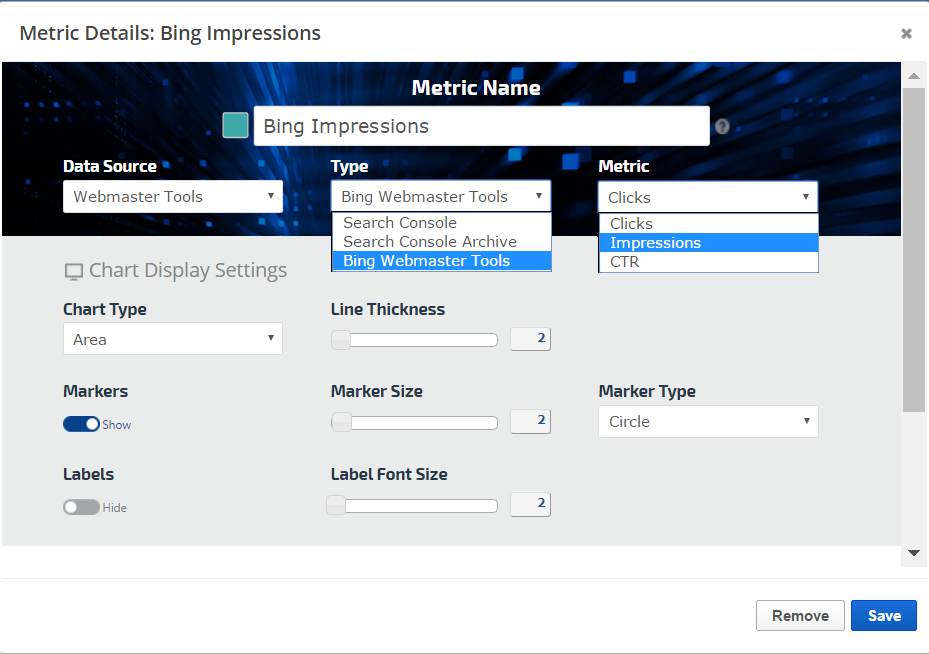
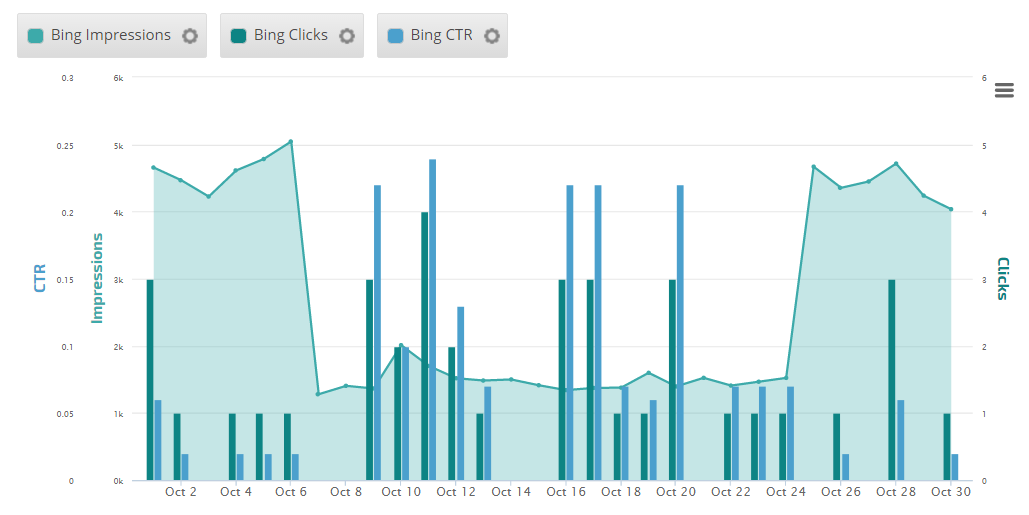
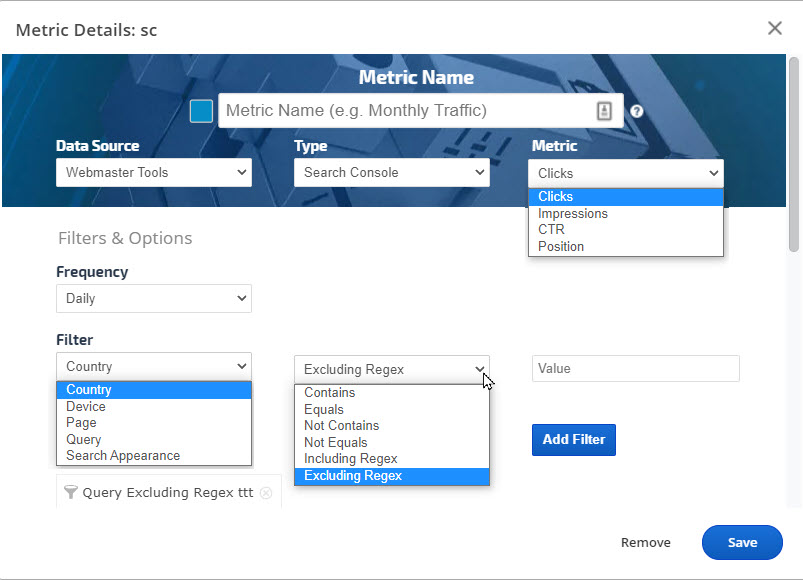
Webmaster Tools
Bing Webmaster Tools
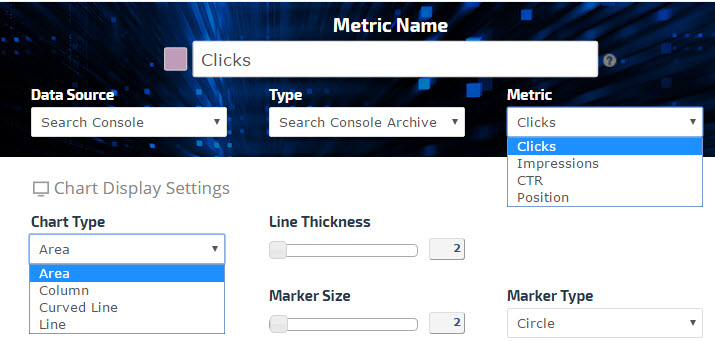
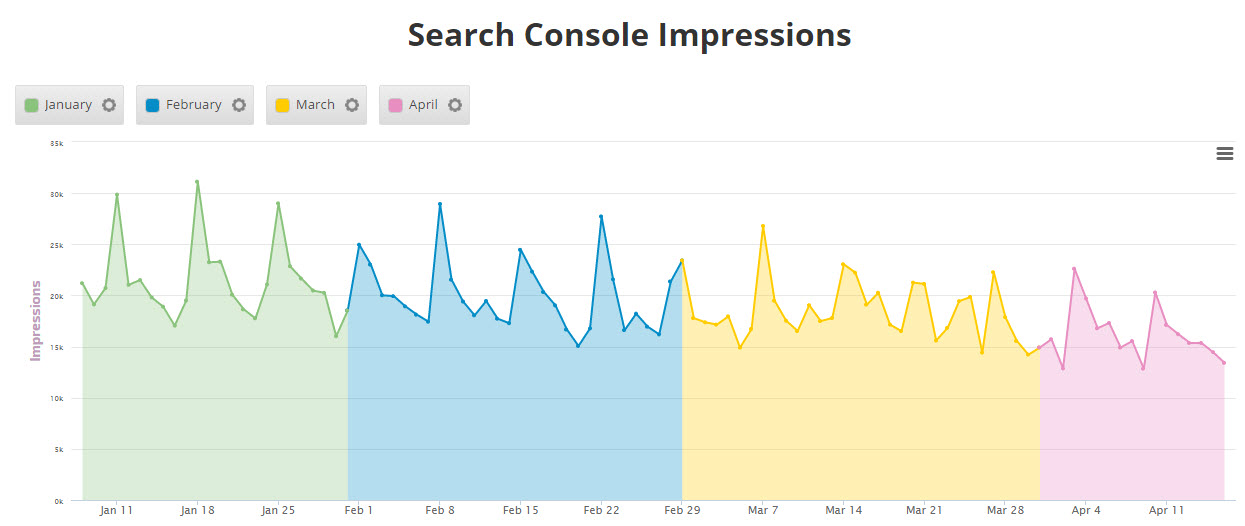
Google Search Console
- Clicks
- Impressions
- CTR
- Position
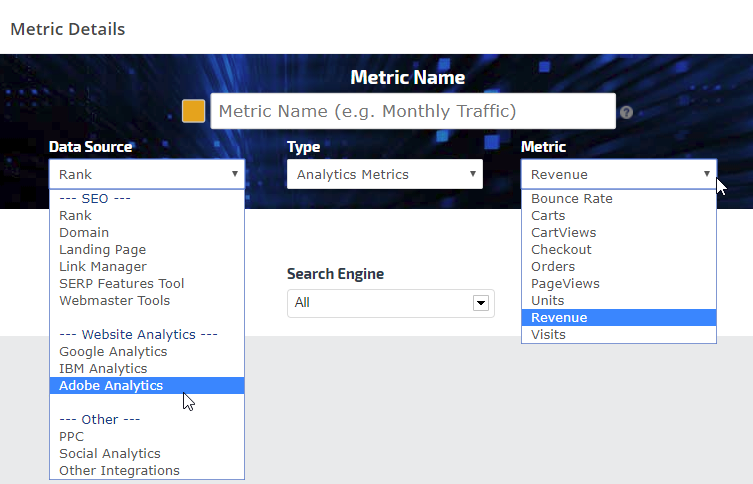
Website Analytics
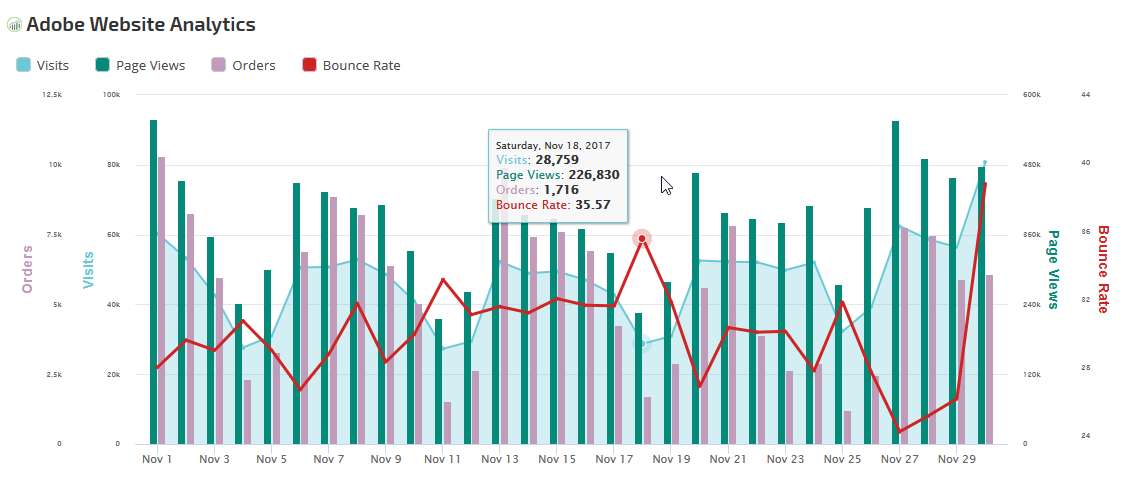
Adobe Analytics
- Average time spent on page (min)
- Average time spent on site (min)
- Bounce Rate
- Carts
- Cart Views
- Checkout
- Custom Link
- Orders
- Page Views
- Revenue
- Unique Visitors
- Units
- Visits
Google Analytics
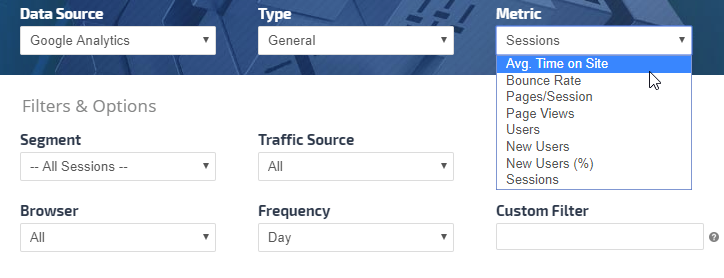
- General: Average Time on Site, Bounce Rate, Pages per Session, Page Views, Sessions, Users, New Users, and New Users (%)
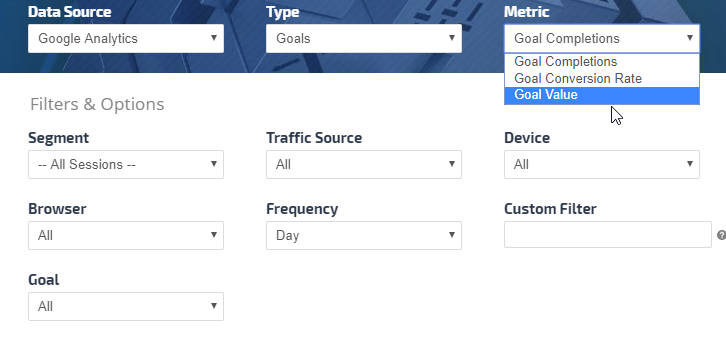
- Goals: Goal Completions, Goal Conversion Rate, Goal Value
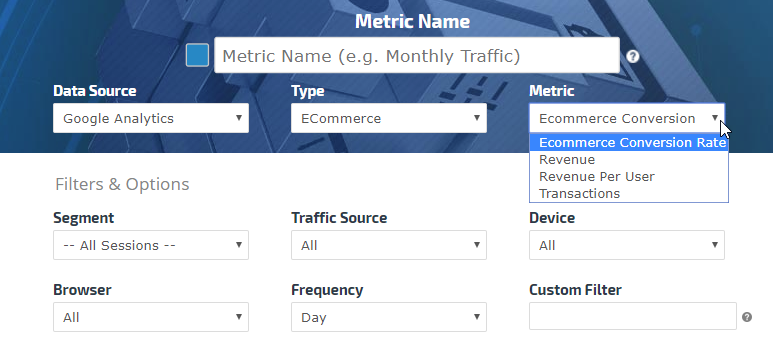
- ECommerce: Ecommerce Conversion Rate, Revenue, Revenue per User, Transactions, Avg, Order Value, Unique Purchases
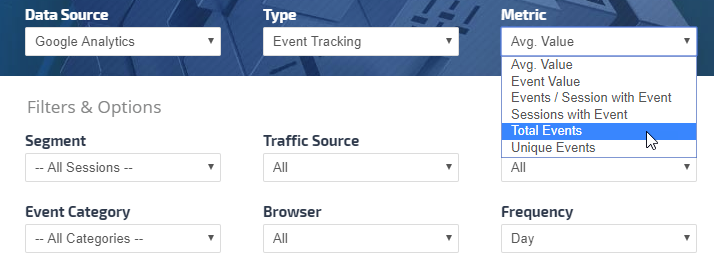
- Event Tracking: Average Value, Events per Session with Event, Event Value, Sessions with an Event, Total Events, Unique Events
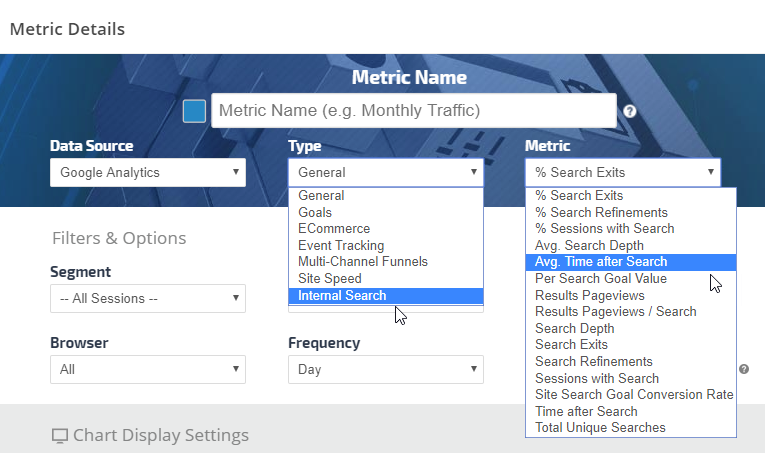
- Internal Search: % Search Exits, % Search Refinements, % Sessions with Search, Avg. Search Depth, Avg. Time after Search, Per Search Goal Value, Results Pageviews, Results Pageviews / Search, Search Depth, Search Exits, Search Refinements, Sessions with Search, Site Search Goal Conversion Rate, Time after Search, Total Unique Searches
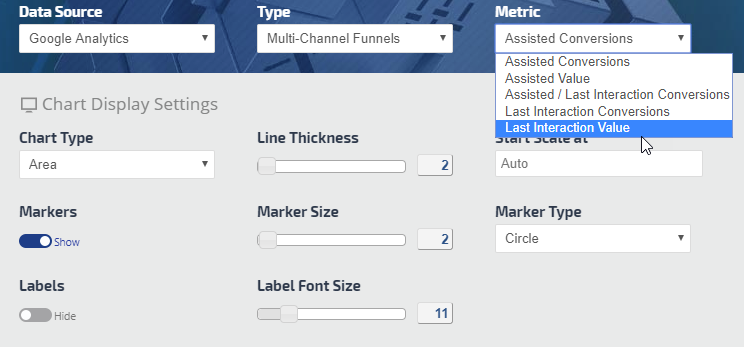
- Multi-Channel Funnels: Assisted Conversions, Assisted / Last Interaction Conversions, Assisted Value, Last Interaction Conversions, Last Interaction Value
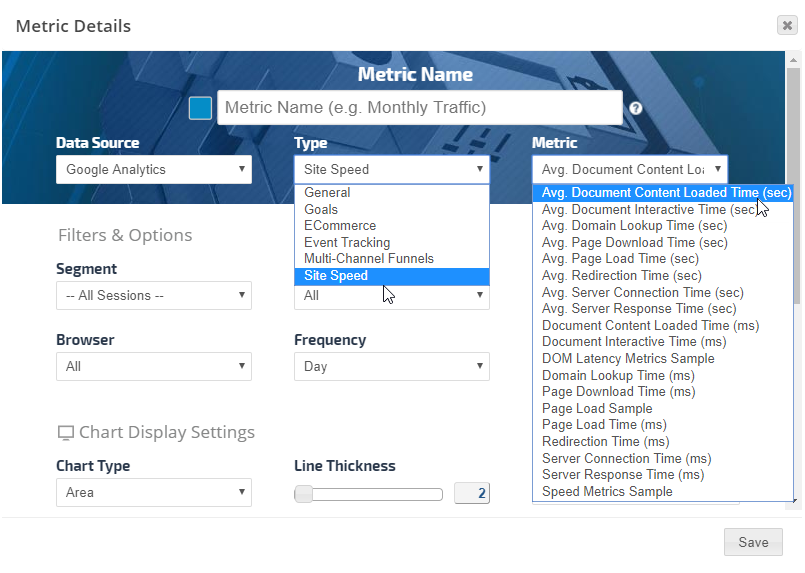
- Site Speed: Avg Document Content Loaded Time (sec), Avg. Document Interactive Time (sec), Avg. Domain Lookup Time (sec), Avg. Page Download Time (sec), Avg. Page Load Time (sec), Avg. Redirection Time (sec), Avg. Server Connection Time (sec), Avg. Server Response Time (sec), Document Content Loaded Time (ms), Document Interactive Time (ms), DOM Latency Metrics Sample, Domain Lookup Time (ms), Page Download Time (ms), Page Load Sample, Page Load Time (ms), Redirection Time (ms), Server Connection Time (ms), Server Response Time (ms), Speed Metrics Sample
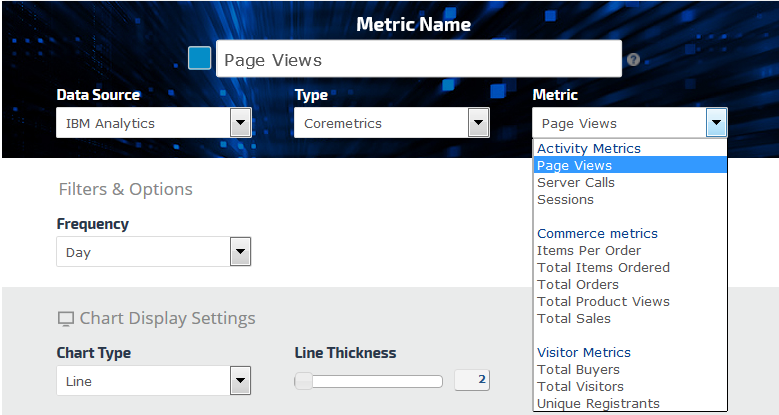
IBM CoreMetrics
- Activity Metrics: Page Views, Server Calls, and Sessions
- Commerce Metrics: Items per Order, Total Items Ordered, Total Orders, Total Product Views, and Total Sales
- Visitor Metrics: Total Buyers, Total Visitors, and Unique Registrants
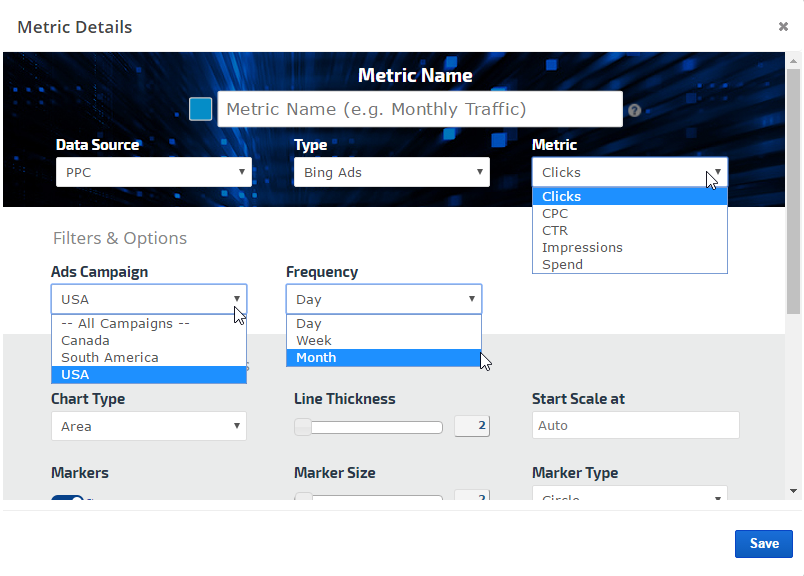
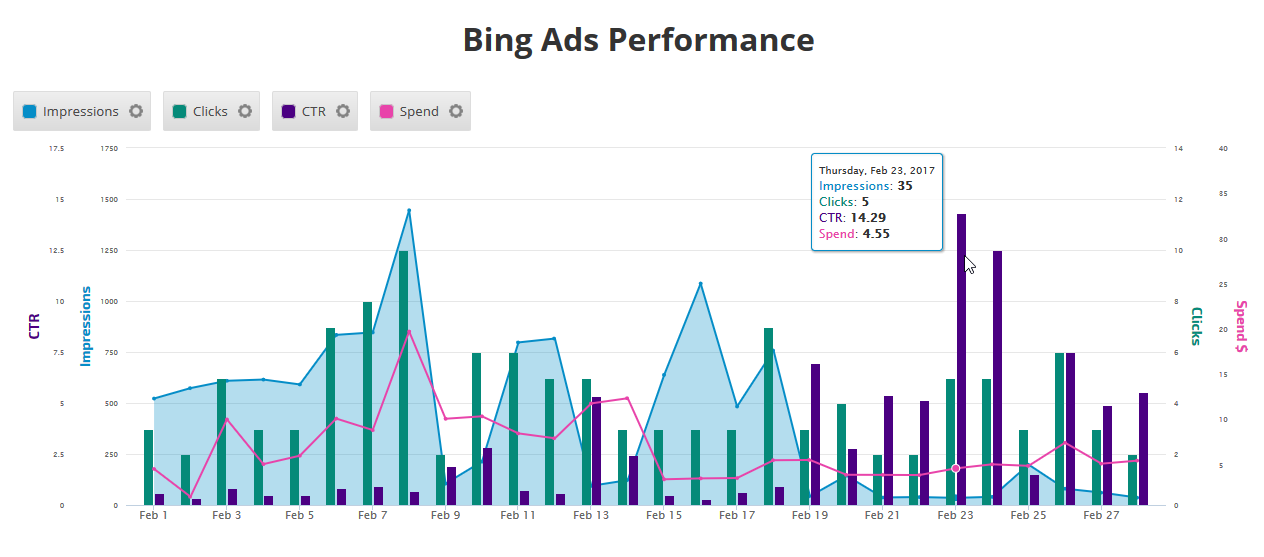
PPC Metrics
Bing Ads Performance
- Clicks
- CPC
- CTR
- Impressions
- Spend
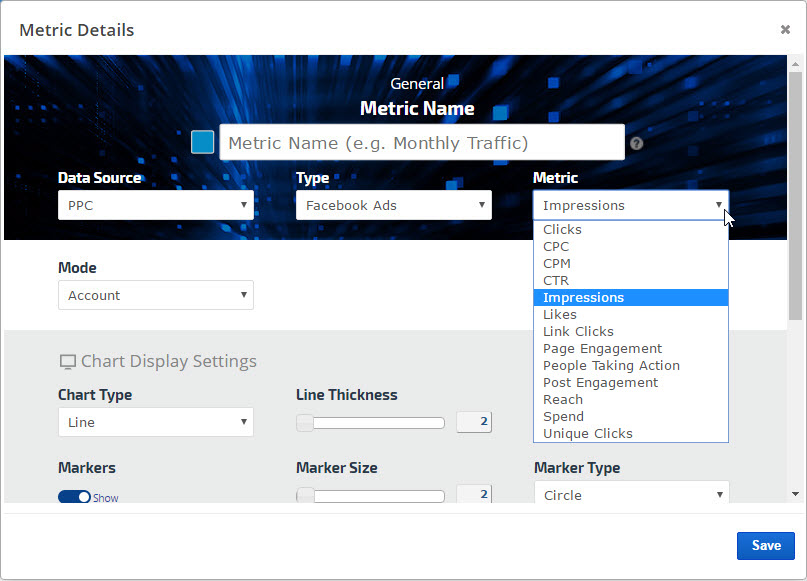
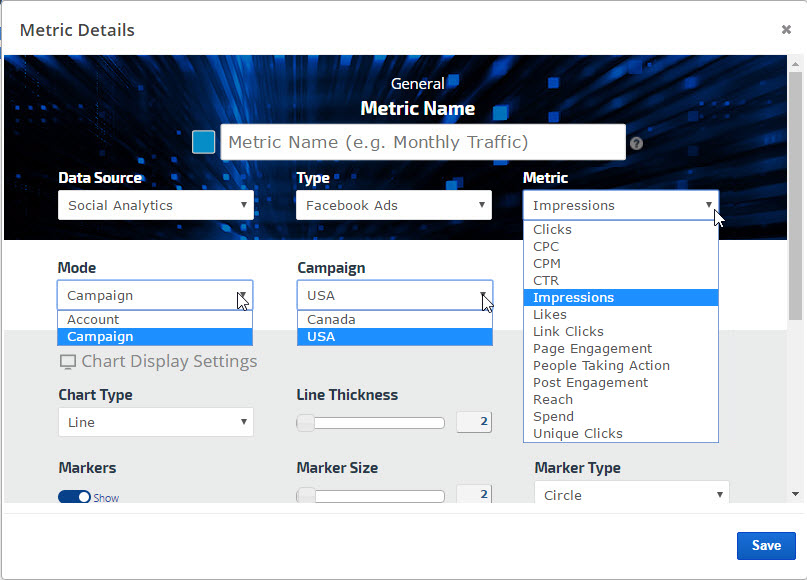
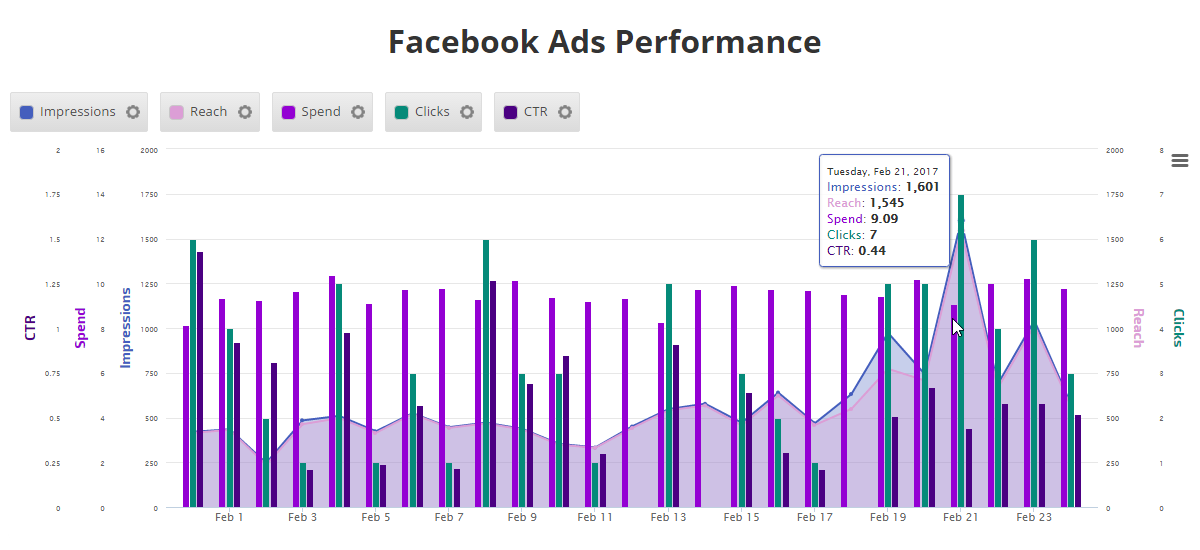
Facebook Ads
- Clicks
- CPC
- CPM
- CTR
- Impressions
- Likes
- Link Clicks
- Page Engagement
- People Taking Action
- Post Engagement
- Reach
- Spend
- Unique Clicks
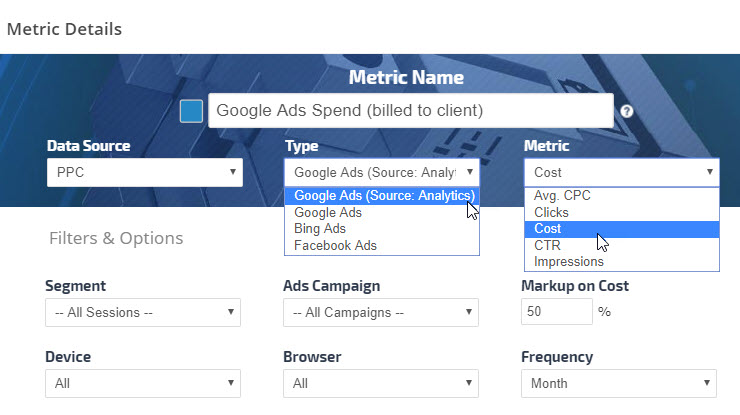
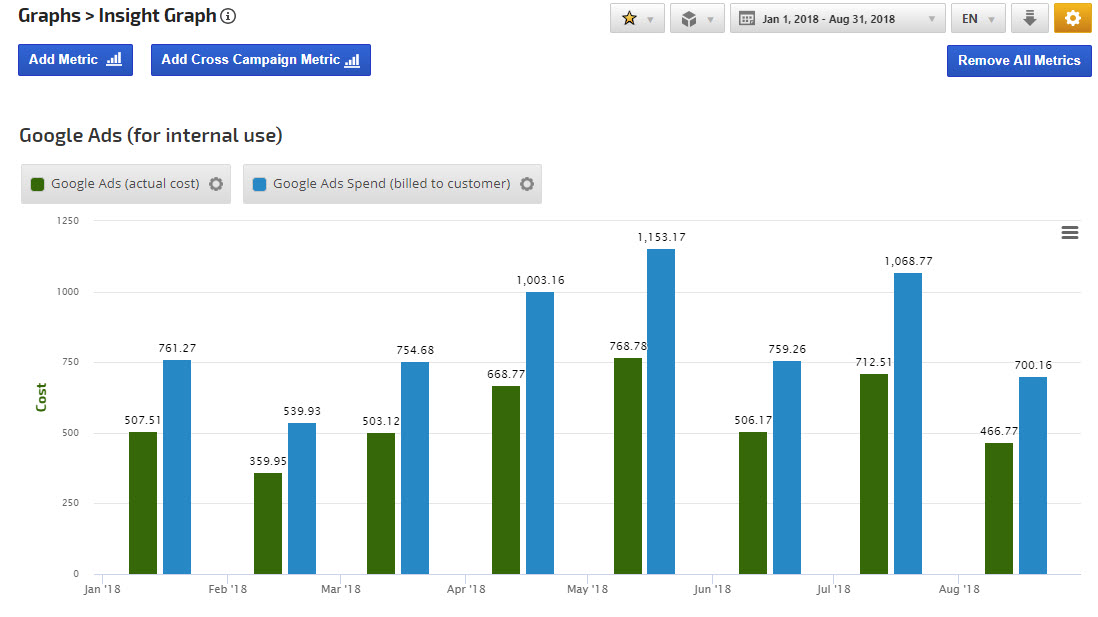
Google Ads (Source: Analytics)
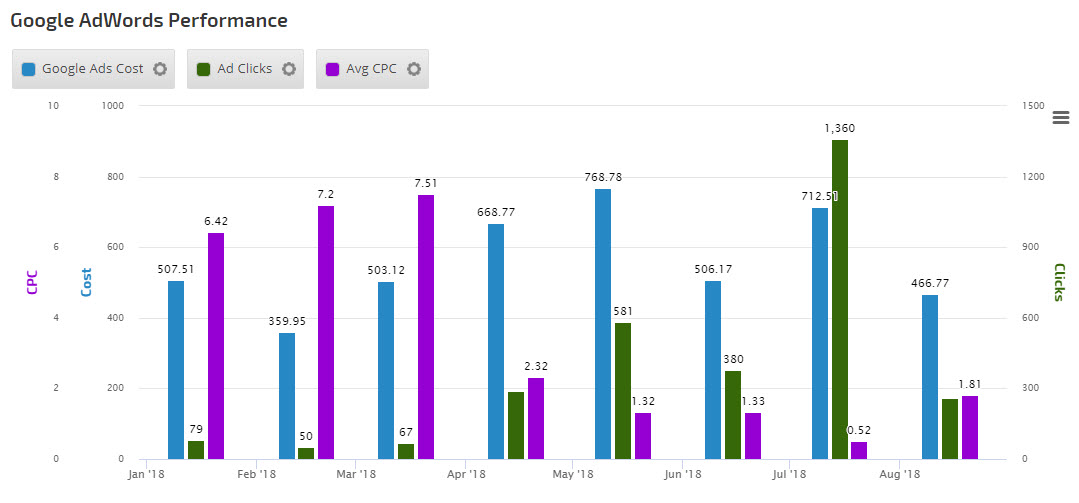
- Average CPC
- Clicks
- Cost
- CTR
- Impressions
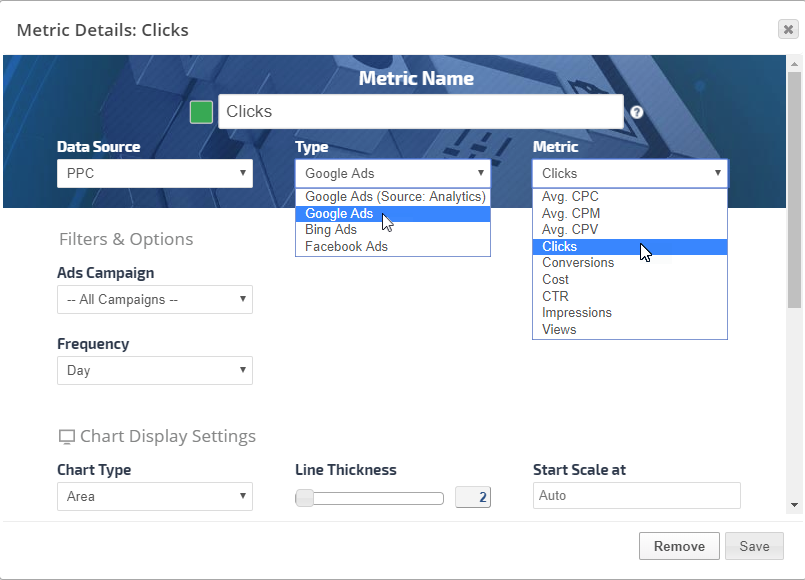
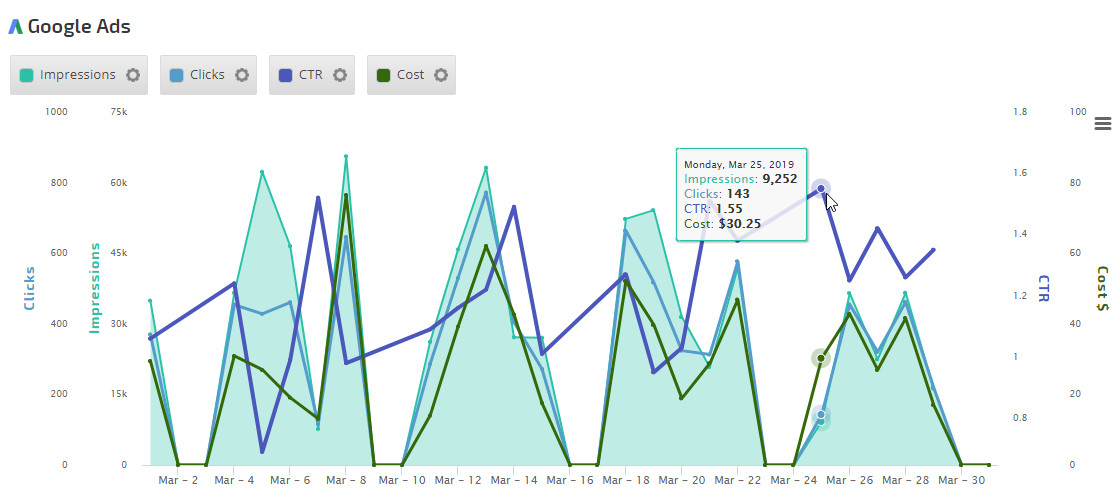
Google Ads (Source: Google Ads script)
- Avg. CPC
- Avg. CPM
- Avg. CPV
- Clicks
- Conversions
- Cost
- CTR
- Impressions
- Views
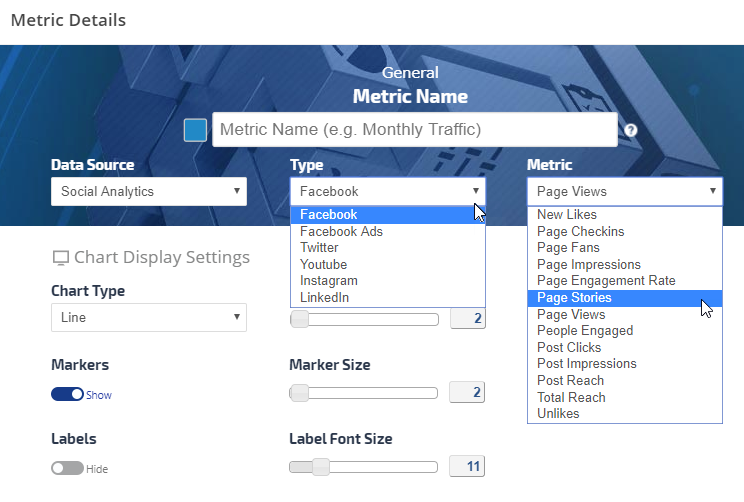
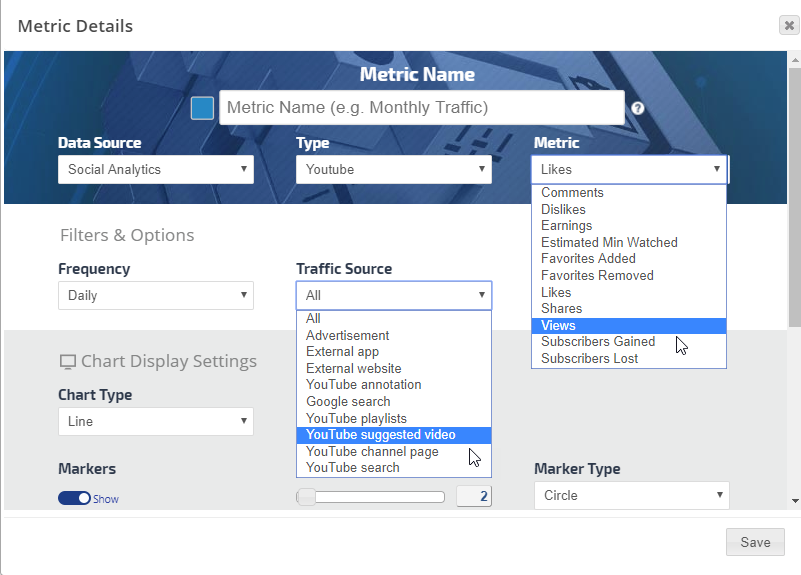
Social Analytics
Facebook
- New Likes
- Page Checkins
- Page Fans
- Page Impressions
- Page Engagement Rate
- Page Stories
- Page Views
- People Engaged
- Post Clicks
- Post Impressions
- Post Reach
- Total Reach
- Unlikes
Instagram
- Followers
- Following
- Total Posts
LinkedIn
- Total Followers Gain
- Organic Followers Gain
- Acquired Followers Gain
- Reach
Twitter
- Followers (Lifetime)
- Following (Lifetime)
- Favorites (Lifetime)
- Tweets (Lifetime)
- Lists (Lifetime)
- Tweets
- Retweets
- Replies
- Favorites Gained
- Retweets Gained
- Mentions
- Mentions Reach
- Mentions Replies
- Mention Replies Reach
- Mention Retweets
- Mention Favorites
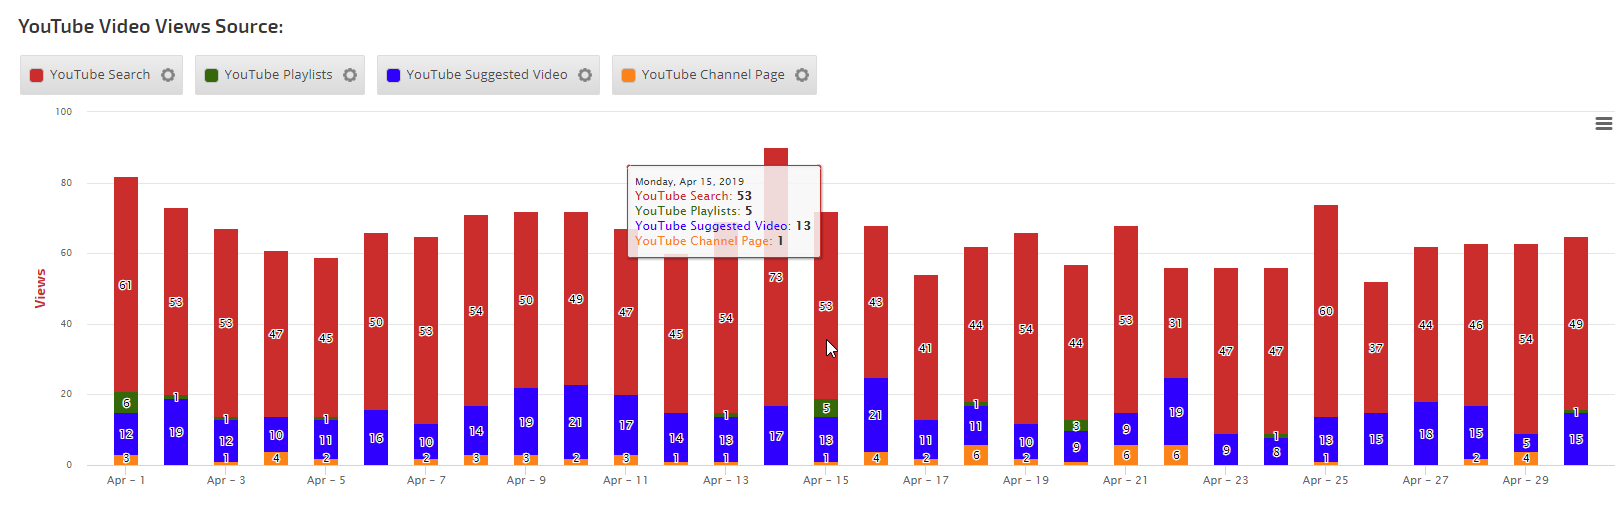
YouTube
- Comments
- Dislikes
- Earnings
- Estimated Minutes Watched
- Favorites Added
- Favorites Removed
- Likes
- Shares
- Views
- Subscribers Gained
- Subscribers Lost
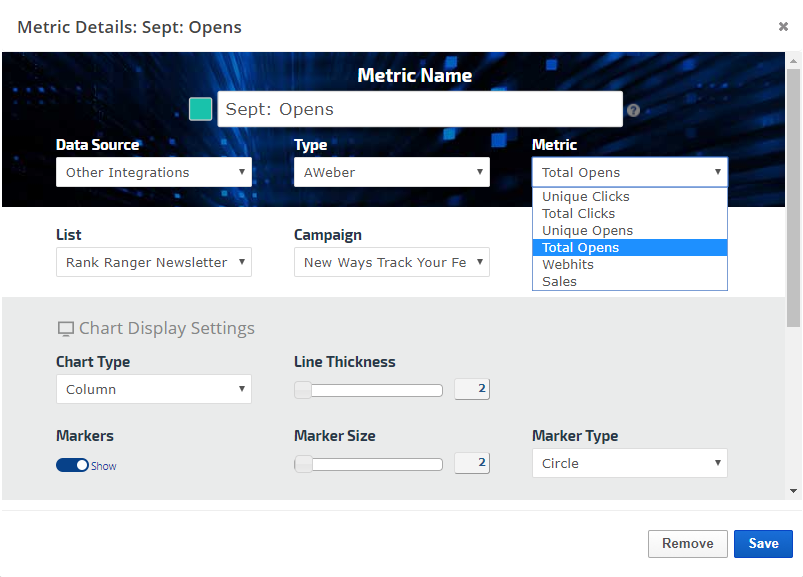
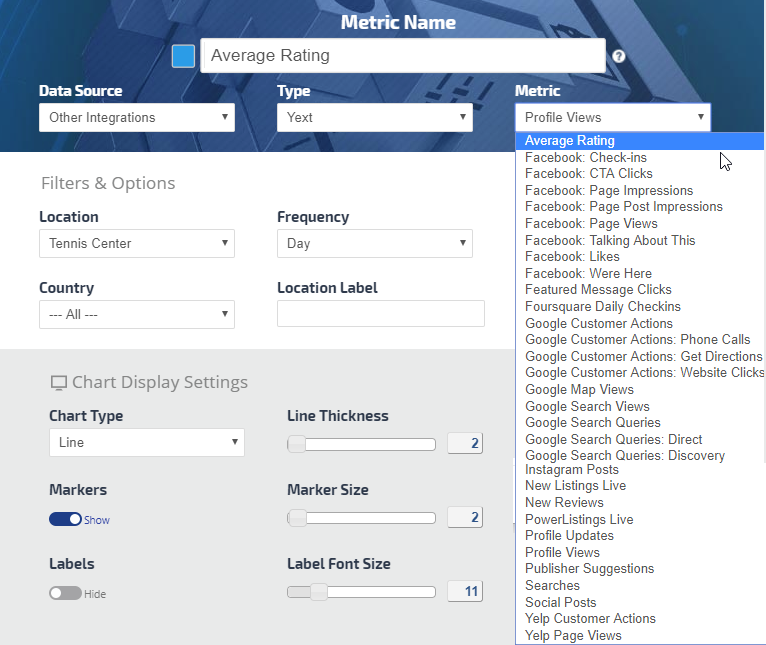
Other Integrations
AWeber: Unique Clicks, Total Clicks, Unique Opens, Total Opens, Webhits, and Sales
CallRail: Answered Calls, Average Duration, First Time Callers, Leads, Missed Calls, and Total Calls
Call Tracking Metrics: Total Calls, Total Callers, Average Ring Time, Average Talk Time, Average Call Duration, Conversions, Revenue
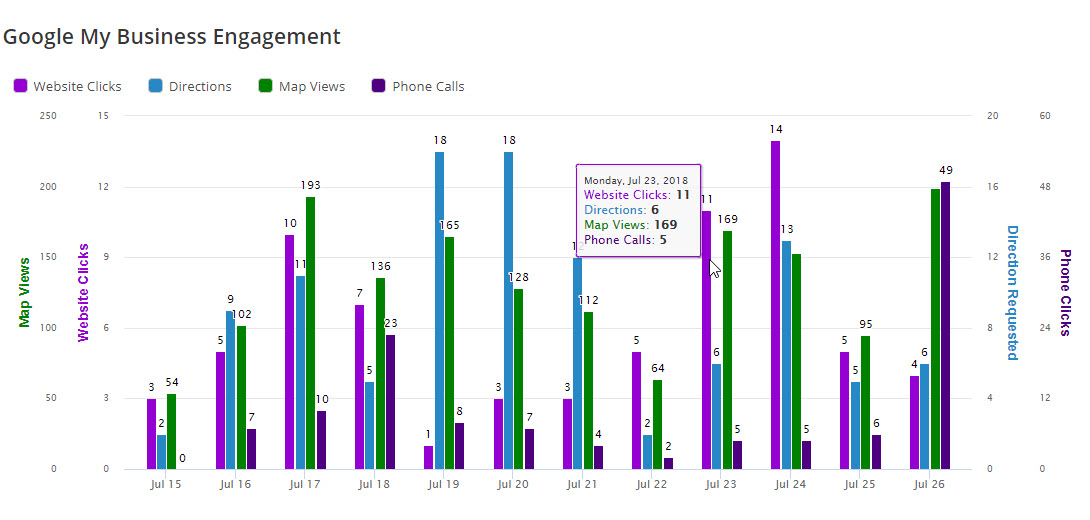
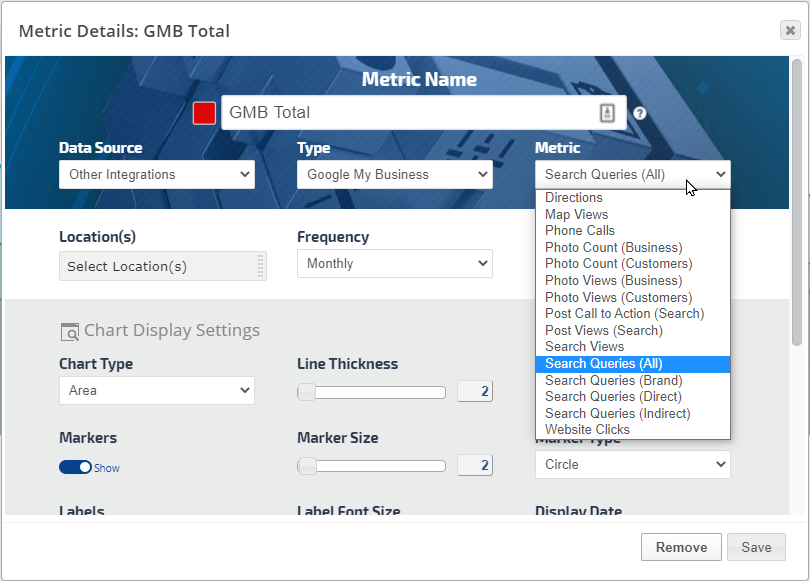
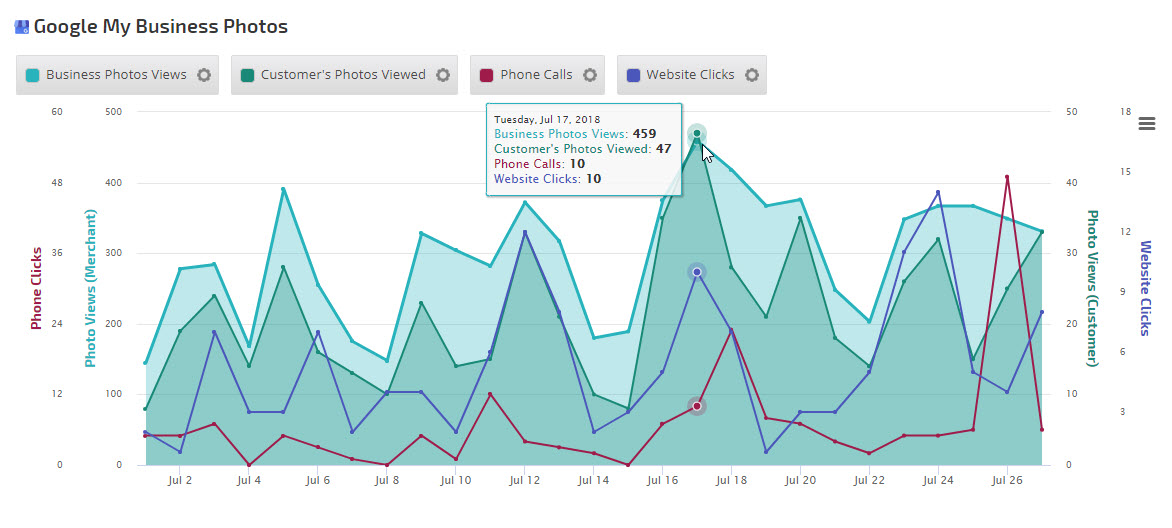
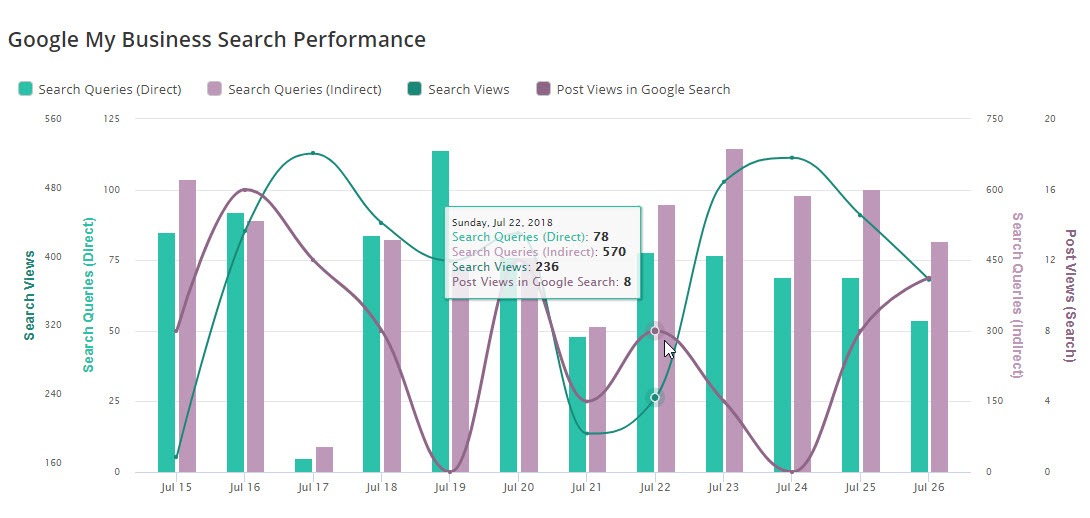
Google My Business: Directions, Map Views, Phone Calls, Photo Count (Business), Photo Count (Customers), Photo Views (Business), Photo Views (Customers), Post Call to Action (Search), Post Views (Search), Search Views, Search Queries (All), Search Queries (Brand), Search Queries (Direct), Search Queries (Indirect), and Website Clicks
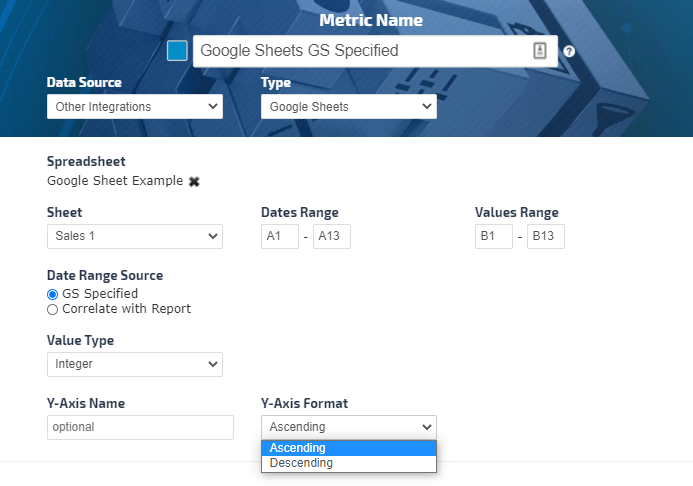
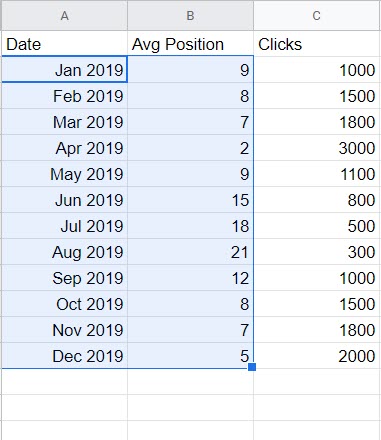
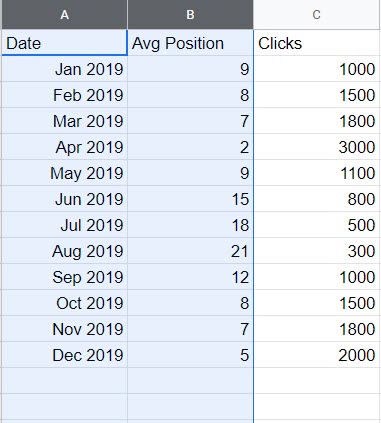
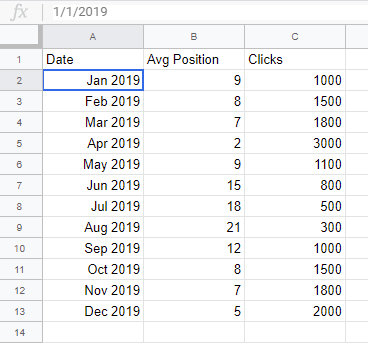
Google Sheets: integrate Google Drive to utilize external data in Rank Ranger metric widgets (
refer to detailed instructions)
Yext: Average Rating, Facebook Check-ins, Facebook CTA Clicks, Facebook Page Impressions, Facebook Page Post Impressions, Facebook Page Views, Facebook Talking About This, Facebook Likes, Facebook Were Here, Featured Message Clicks, Foursquare Daily Checkins, Google Customer Actions, Google Customer Actions Phone Calls, Google Customer Actions Get Directions, Google Customer Actions Website Clicks, Google Map Views, Google Search Views, Google Search Queries, Google Search Queries Direct, Google Search Queries Discovery, Instagram Posts, New Listings Live, New Reviews, PowerListings Live, Profile Updates, Profile Views, Publisher Suggestions, Searches, Social Posts, Yelp Customer Actions, Yelp Page Views


