Metric Widgets can be added to white label PDF Reports, Client Dashboards, and Marketing Dashboards to create a colorful high-level summary or comprehensive dashboard of the marketing metrics most important to each campaign.
Client Dashboards can have 1 page of single metric widgets per campaign, Marketing Dashboards and PDF reports can have multiple versions of single metric widget pages because they are constructed in a modular, multi-report manner.
For a detailed listing of the many metrics that can be displayed in these widgets, please refer to the Insight Graph documentation as both use the same metrics.
- SEO
- Rank Tracker
- Local SEO
- Mobile SEO
- Link Manager
- Landing Pages
- Social Signals
- On-Page Optimization
- Enterprise SEO Solutions
- Marketing
- Competition Analysis
- Insight Graph
- Keyword Research
- Graphs & Widgets
- Market Reach
- Marketing KPI
- Brand Visibility
- White Label SEO
- Marketing Dashboard
- Client Dashboard
- PDF Reports
- PDF Templates
- Other
- Email Notifications
- Portfolio Management
- Integrations
- Google Analytics
- Search Console
- Pay Per Click
- WeDevelop
- API
Metric Widgets
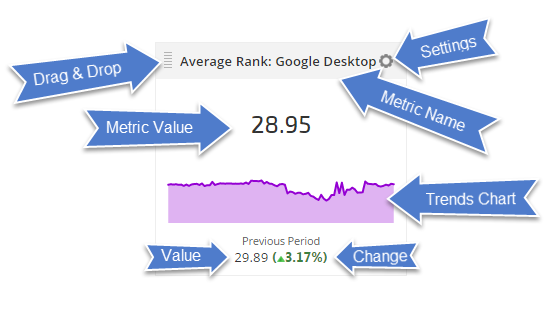
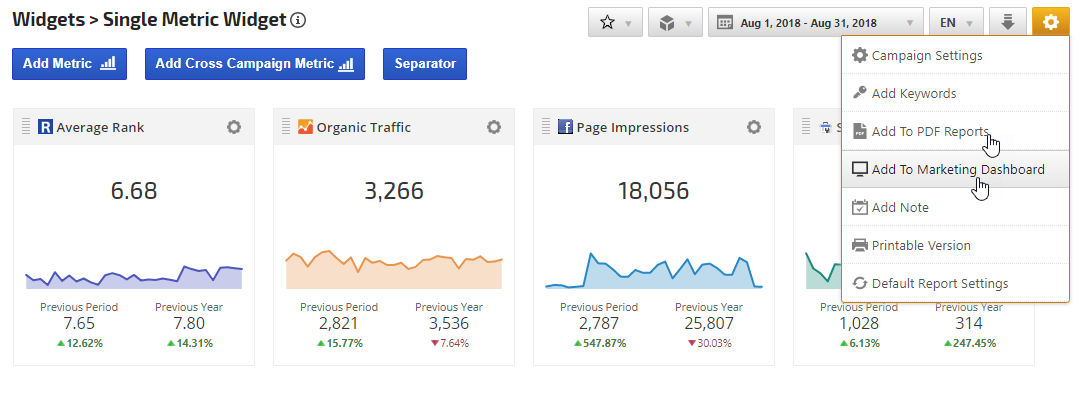
After a widget has been created, you can click the gear icon (top right) to access the widget settings. Click the bars icon in the top left to drag to drag and drop the widget to a different position in a multiple widget report.
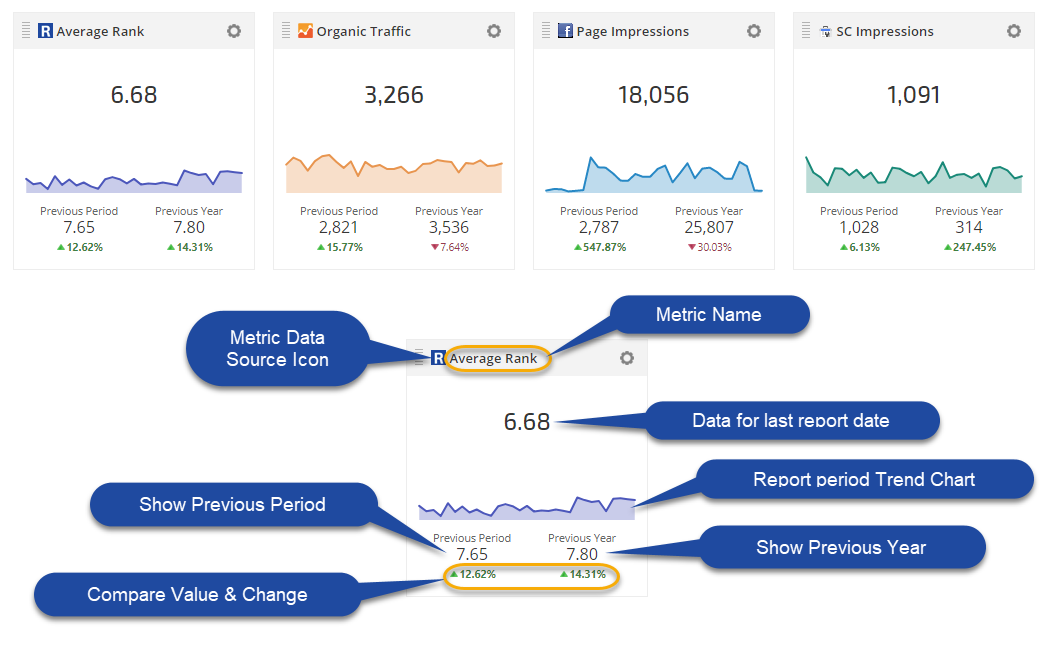
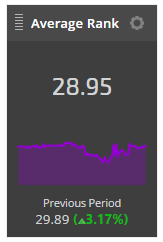
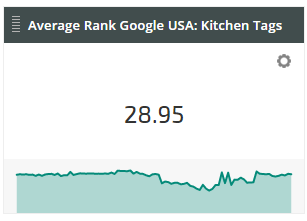
The metric number in the center (e.g., 6.68 in the above example) is the data for the last date of the report.
The Trend Chart data is based on the Frequency Filter setting and Trend Chart Date Range selection.
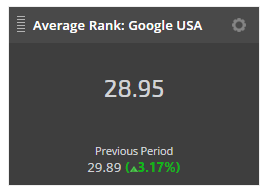
The Previous Period
- Metric number is the data for the same number of days as a current month for the previous month. (For example, the current date range is 30 days so the previous period will be the previous 30 days). The Data Source: Google Analytics and PPC have two Previous Period options: Date Range and Calendar Month. The Date Range metric is the data for the previous month with the same number of days as the current date range. The Calendar Month is the data for the full previous calendar month. *Note: In order to collect correct Previous Period Calendar Month data, the current date range must start from the first day of the month.
- The % is the change between the metric data for the last date range of the report period and data for the same date range of the previous month.
- Metric number is the data for the same date last year
- The % is the change between the metric data for the last date of the report period and the data for the same date last year.
Buttons and Settings

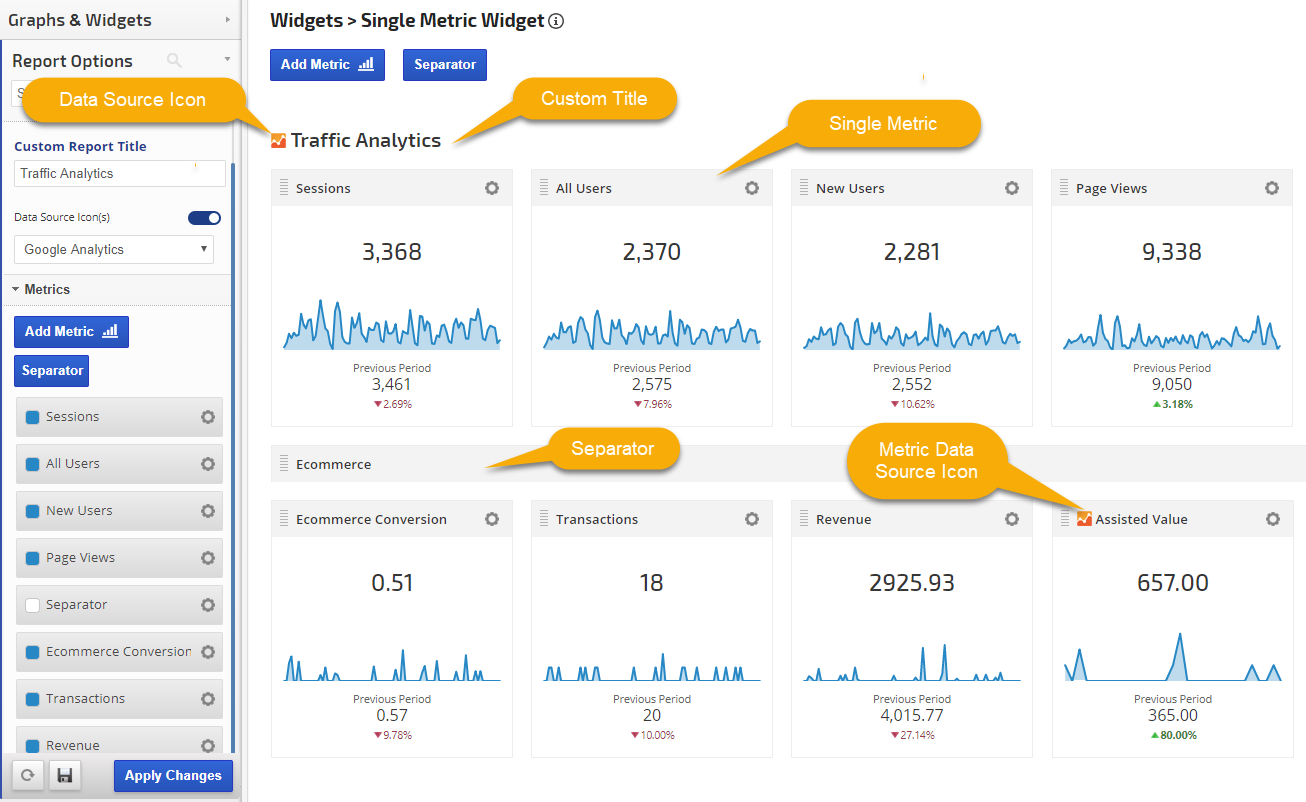
In the screenshot above the following features are highlighted:
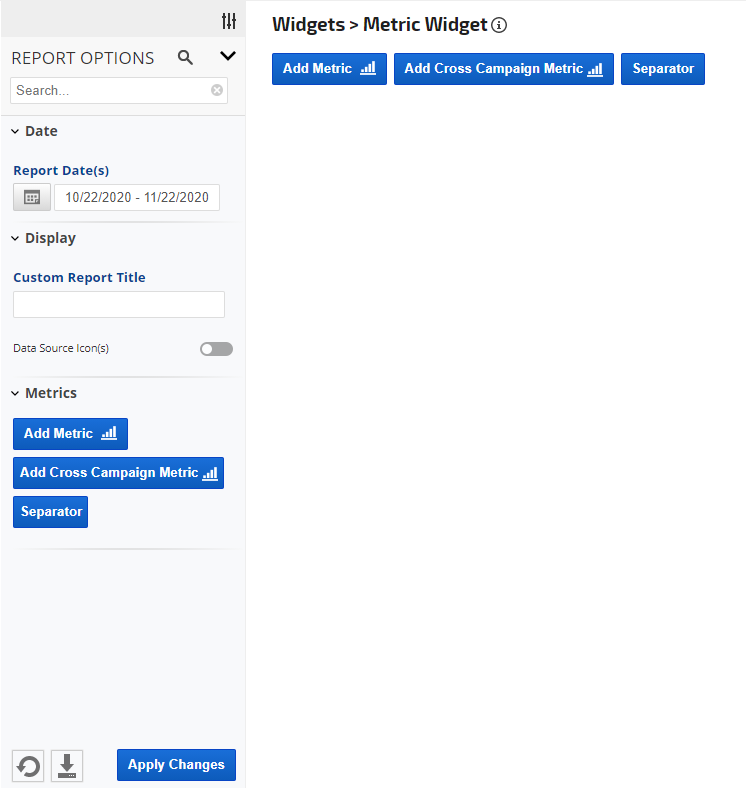
1. Add Metric button launches the metric settings screen in which you can select everything from data type to color and features to be displayed.
2. Add Cross Campaign Metric button is available only with Enterprise packages. In addition to the settings available in the "Add Metric" button, you may select a campaign other than the one you're building the widget page in. This is useful when creating multiple campaigns for the same client (e.g., website campaign plus YouTube channel campaign, Corporate campaign vs. individual franchise location campaigns, etc.)
3. Add Custom View Metric button allows data from multiple campaigns to be aggregated (learn more...)
4. Separator button allows you to insert a separator bar, with or without a title, in order to organize the display of widgets into logical groupings.
5. Remove All Metrics button deletes all metric widgets from the page. Before using that, we caution you to consider if you may need to access those widgets again, and if so, create a Preset first (refer to 6 below).
6. Date Range can be adjusted for the data that you want to view on this screen. The date range that displays in Client Dashboards, Marketing Dashboards, and PDF reports will be determined by the settings in those tools.
7. Report Presets allow you to save multiple versions of the same report. This is a great feature for Single Metric Widgets, allowing you to create 1 version for rank, another for traffic, another for social media, etc. (learn more...)
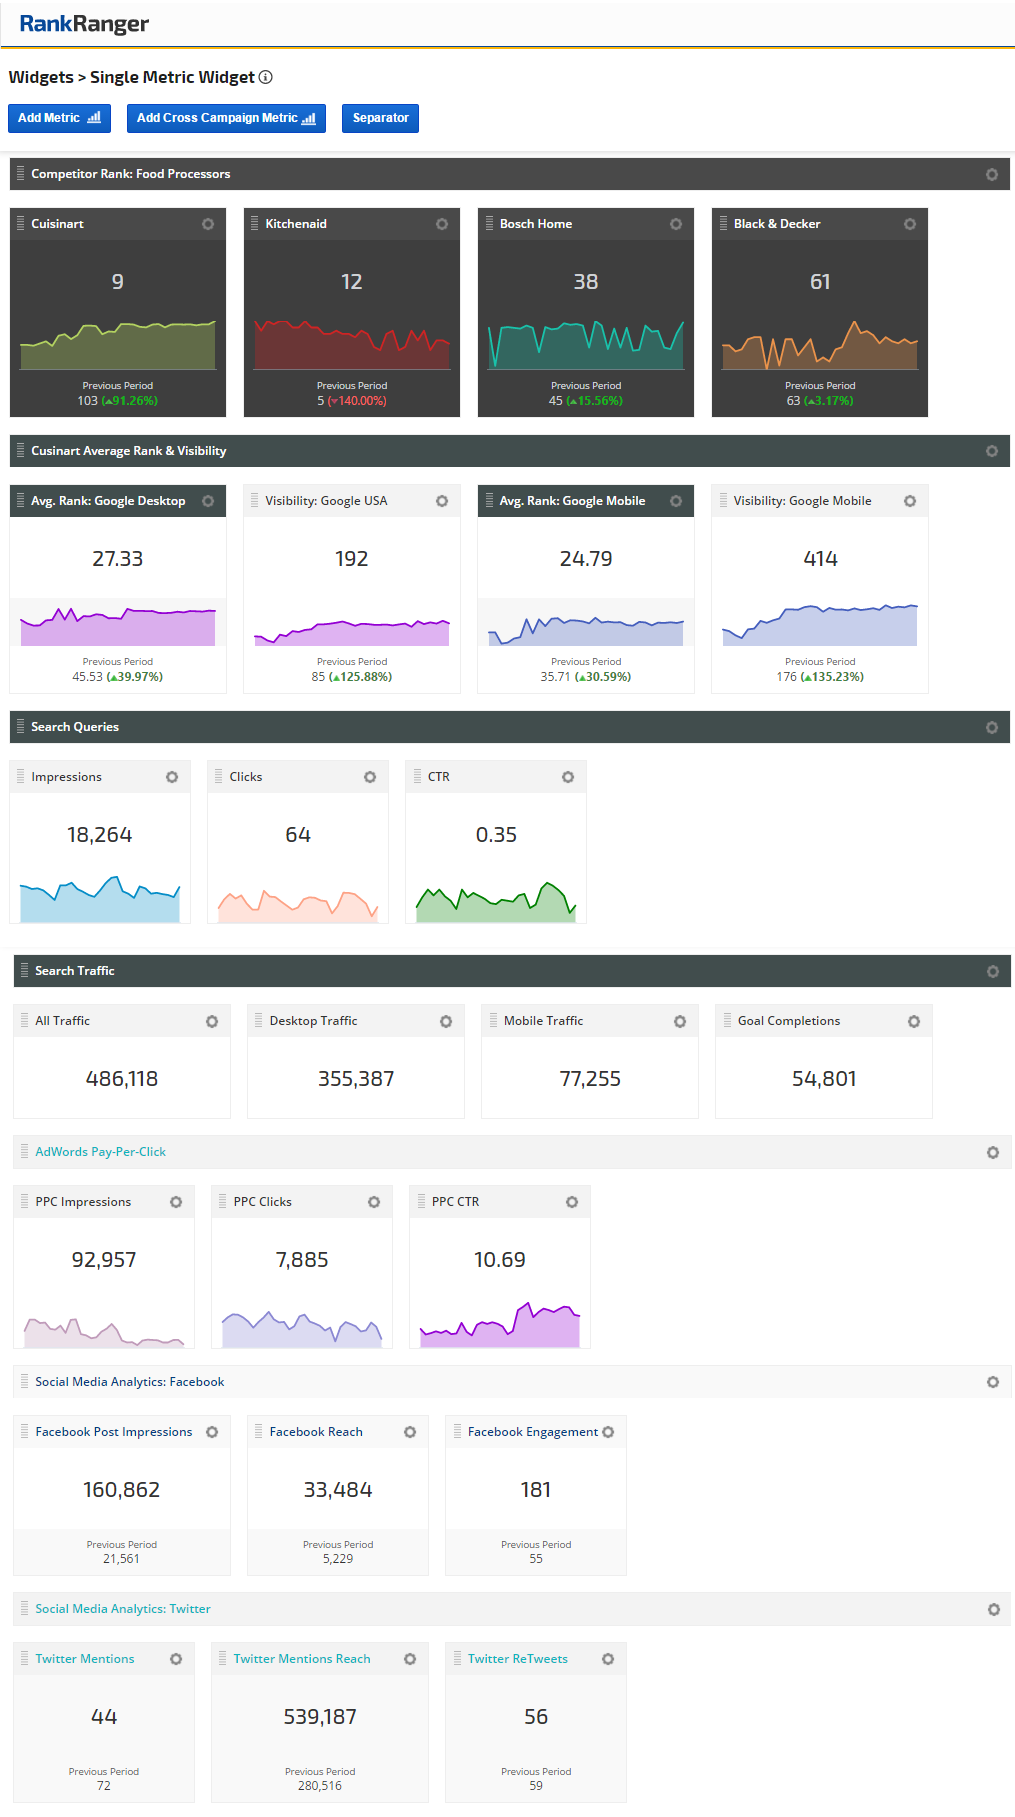
Page of Metric Widgets
This is what a widget page can look like after a number of widgets have been created. In this screenshot, we've explained how the settings and features are labeled.
This is what a widget page can look like after a number of widgets have been created. In this screenshot, we've explained how the settings and features are labeled.
Widget with Trend Chart, Compare to Previous Value & Change (default theme box width 250)
Widget with Trend Chart, Compare to Previous Value & Change (black theme, box width 150)
Widget (aqua theme, box width 200)
Widget with Previous Period Value & Change (black theme, box width 300)
Widget with Trend Chart(black & white theme, box width 300)
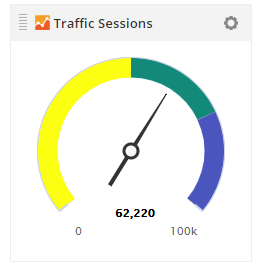
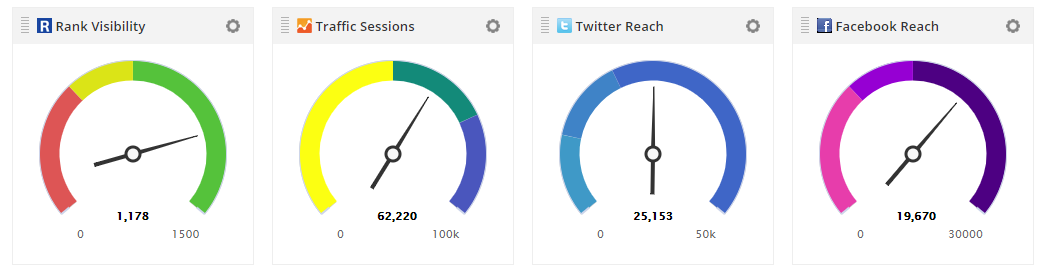
Gauge Widget
A Group of Single Metric Trend Widgets
A Group of Gauge Widgets
Widgets in a White Label Marketing Dashboard
This marketing dashboard was built with a variety of single metric widgets. As demonstrated, it is possible to have multiple widgets of varying colors and themes on a page.
This marketing dashboard was built with a variety of single metric widgets. As demonstrated, it is possible to have multiple widgets of varying colors and themes on a page.
The Metric Name you enter displays across the top of the widget and you have the option to show or hide the Trends Chart, Previous Period Value, Previous Year Value, and Change between current and previous dates. If you're placing multiple widgets on one Web Dashboard screen or in a PDF report, you can drag and drop each widget into the order you prefer.
Add a Metric
Click the Add Metric (or if you have an Enterprise package then you may also choose the Add Cross Campaign Metric button), or you can expand the Report Options section of the screen and add a Custom Report Title and individual Metrics.
Click the Add Metric (or if you have an Enterprise package then you may also choose the Add Cross Campaign Metric button), or you can expand the Report Options section of the screen and add a Custom Report Title and individual Metrics.
- Click the Add Metric button to create a Single Metric Widget for the campaign that is displayed in the upper right of the screen.
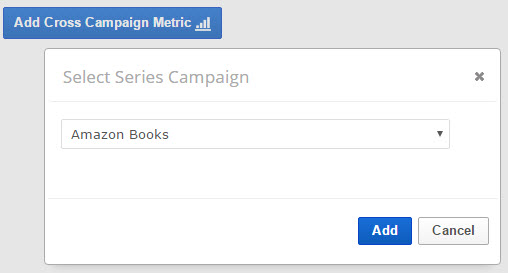
- If your account has an Enterprise package, you can click the Add Cross Campaign Metric to add a metric associated with a different campaign, and then select the campaign.
Data Source
Select a Data Source and Metric (refer to the Data Source Options section in this documentation for a list of the available metrics).
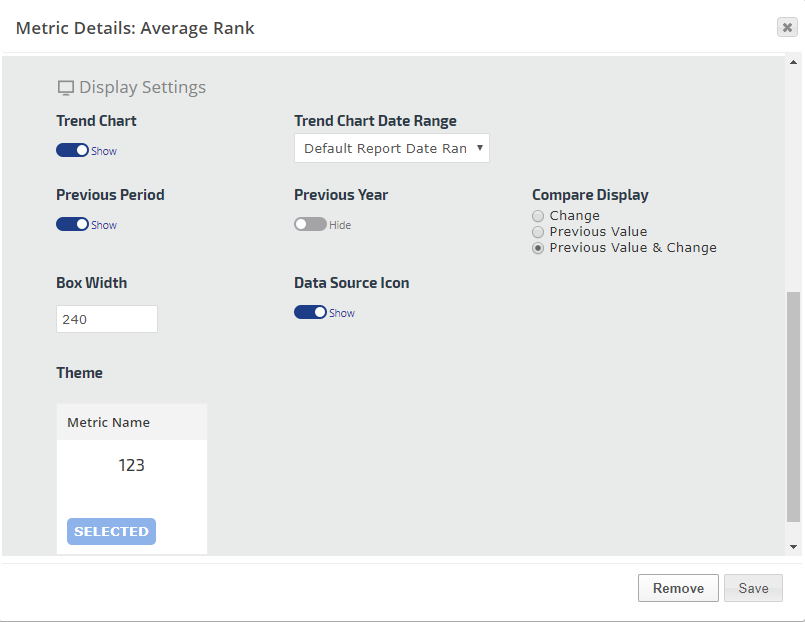
Some metrics have additional options and filters, in this example, Average Rank has options to select:
- Domain: the primary campaign domain or one of the additional websites (e.g., competitors) added to the Websites screen in campaign settings.
- Search Engine: choose from any of the search engines tracking in the campaign.
- Keyword Tags: select individual or all Tags and filter for keywords that Contain at least 1 selected Tag (OR) or Require that all selected Tags (AND) meet the Average Rank Rules you select below.
- Frequency: choose from Day, Week, or Month
- Results: filter Rank results by Top 10, Top 20, etc.
- Average Rank Rules: If you want the Average Rank calculated differently than the actual rank, then enter a Rank Threshold number.
Rank Value: enter the value you want Rank Ranger to use for keyword rank that is higher than the Rank Threshold you've chosen. Keyword rank value will then be calculated based on the number you set in the Rank Value field.
Enter 0 if you want the keyword ignored completely when calculating average rank.
Leave the Threshold at 100 and Rank Value at 0 to have the actual rank value used in calculating Average Rank, this is our default method.
Metric Name and Trends Chart Color
Enter a Name for your metric for the label that displays across the top of it.
Click the Color Selector to change the color of the Trends Chart.
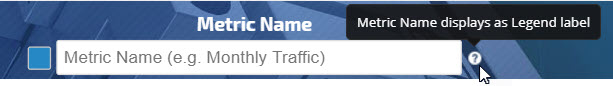
Enter a Name for your metric for the label that displays across the top of it.
Click the Color Selector to change the color of the Trends Chart.
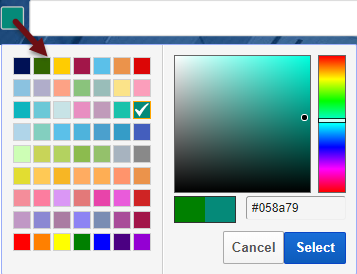
Color Selector
Click the color box to the left of the Metric Name to launch the Color Selector. Choose a color for the display of the selected metric on the trends chart. Options include:
Click the color box to the left of the Metric Name to launch the Color Selector. Choose a color for the display of the selected metric on the trends chart. Options include:
- select a standard color from the palette
- slide the color bar and drag the dot until the color you want is displayed
- enter a Hex color value
Display Setting Options
Display Settings allow you to control the design of your Single Metric Widget:
Display Settings allow you to control the design of your Single Metric Widget:
- Trend Chart: Show or Hide
- Previous Period: Show or Hide
- Compare Display: is available when Previous Period is set to Show. Select Previous Value, Change, or both Previous Value and Change.
- Trend Chart Date Range: Choose from Default Report Date Range, Last 3 months, Last 6 months, or Last 12 months
- Box Width: set this to the size you want the widget to display as on the screen, in a PDF report, or in Web Dashboard
- Theme: Select the theme design you want for this widget.
Default Gauge Settings
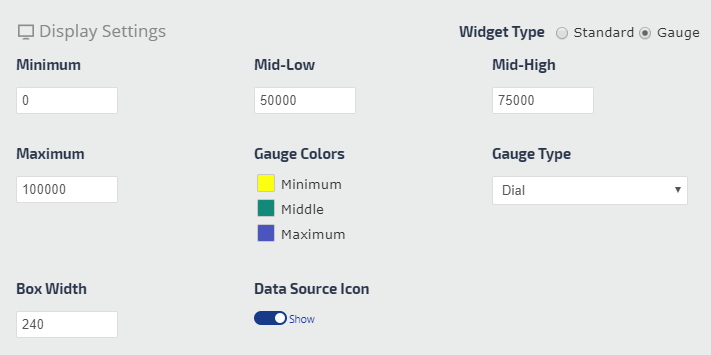
In the widget display settings Widget Type, select Gauge and you'll see these default settings
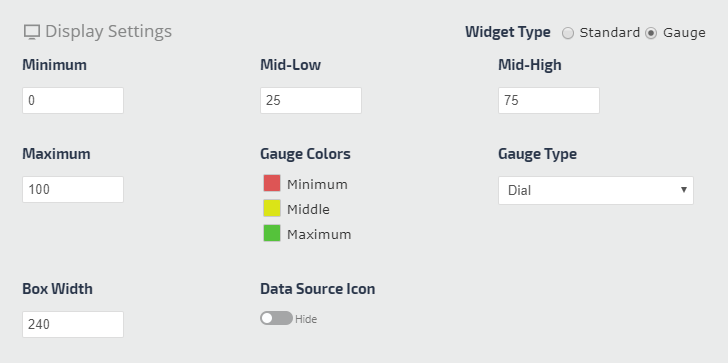
In the widget display settings Widget Type, select Gauge and you'll see these default settings
Based on the widget metric and your knowledge of the average results and goals, enter numbers in these fields:
Box Width: the default box width of 240 will allow for:
Data Source Icon: enable this feature if you want the icon of the data provider (e.g., Rank Ranger, Google Analytics, Facebook, Twitter, etc.) to display in the top-left area of the widget.
- Minimum: this should remain at 0 unless you want the gauge scale to be different, this setting corresponds to the "Minimum" color
- Mid-Low: choose a number between the minimum and maximum you enter, this setting corresponds to the "Middle" color
- Mid-High: choose a number between the minimum and maximum you enter, this setting corresponds to the "Maximum" color
- Maximum: this could be your target goal or higher.
Box Width: the default box width of 240 will allow for:
- up to 4 gauges per row in a typical marketing dashboard, if you want 5 then change this to 200, if you plan to only use 3 then you could make them wider or keep the default.
- up to 3 gauges per row in a Portrait orientation PDF report
Data Source Icon: enable this feature if you want the icon of the data provider (e.g., Rank Ranger, Google Analytics, Facebook, Twitter, etc.) to display in the top-left area of the widget.
Gauge Color Settings
To change the color of a range area of the gauge, click the color block and select the new color from the palette or enter a Hex color number
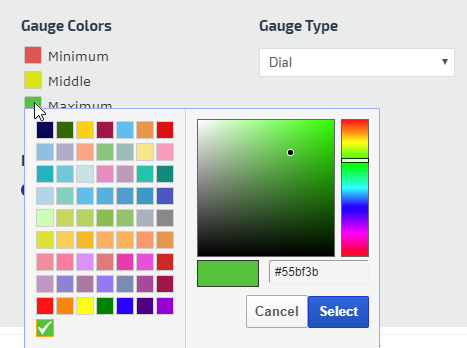
To change the color of a range area of the gauge, click the color block and select the new color from the palette or enter a Hex color number
Sample Gauge Widget
Sample Widget Settings
To create the sample widget above, we used the following Gauge display settings:
For negative metrics, such as Facebook Unlikes, YouTube Subscribers Lost and CallRail Missed Calls, etc., you can adjust the minimum to a positive color and maximum to a negative color.
To create the sample widget above, we used the following Gauge display settings:
- Minimum: 0
- Mid-Low: 50000
- Mid-High: 75000
- Maximum 100000
- Gauge Colors were selected from the color palette
- Gauge Type: Dial
- Box Width: 240
- Data Source Icon: enabled
For negative metrics, such as Facebook Unlikes, YouTube Subscribers Lost and CallRail Missed Calls, etc., you can adjust the minimum to a positive color and maximum to a negative color.
Sample Display Settings for Reverse Scale Metrics
Metrics for which the minimum value is more desirable than the maximum (e.g., Rank, Bounce Rate, etc.), the default display settings look like this:
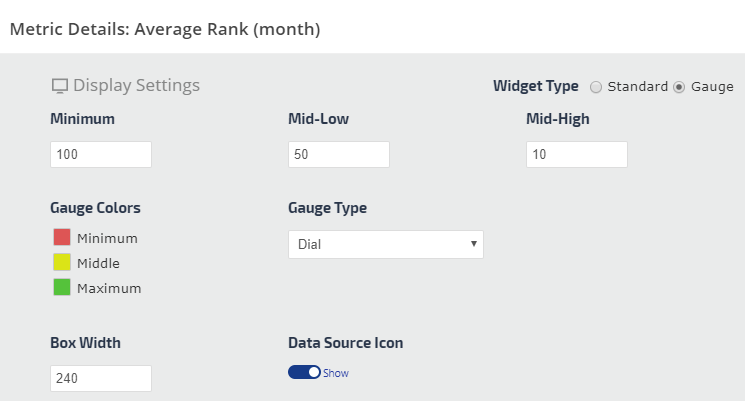
Metrics for which the minimum value is more desirable than the maximum (e.g., Rank, Bounce Rate, etc.), the default display settings look like this:
Example of Reverse Scale Metrics
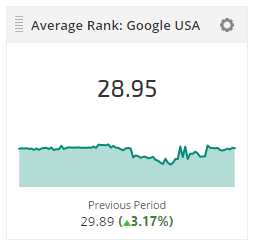
Average Rank, Rank for an individual keyword, Bounce Rate, and Search Console Position utilize the default settings described above.
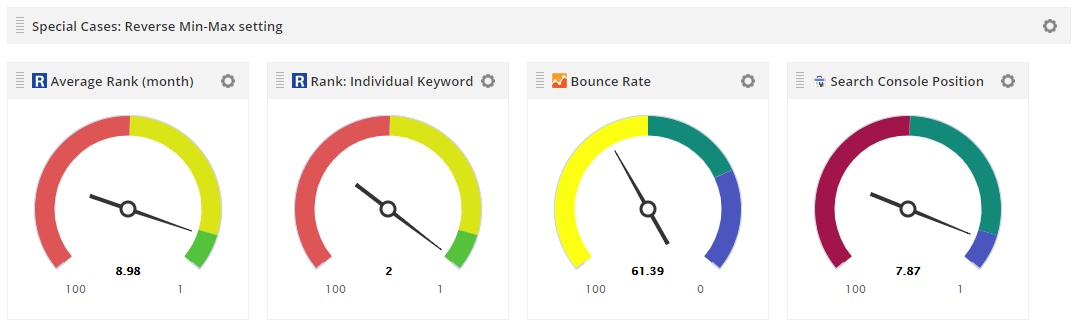
Average Rank, Rank for an individual keyword, Bounce Rate, and Search Console Position utilize the default settings described above.
Build a Panel or Page full of Gauge Widgets
To build a panel of gauge widgets, simply add multiple gauges and configure their display settings. Refer to the Add Title or Page Break section of this documentation for further page formatting instructions.
Separators
Separators span the width of the page and can be used to add a title to a section of Single Metric Widgets or to insert a page break for display PDF reports.
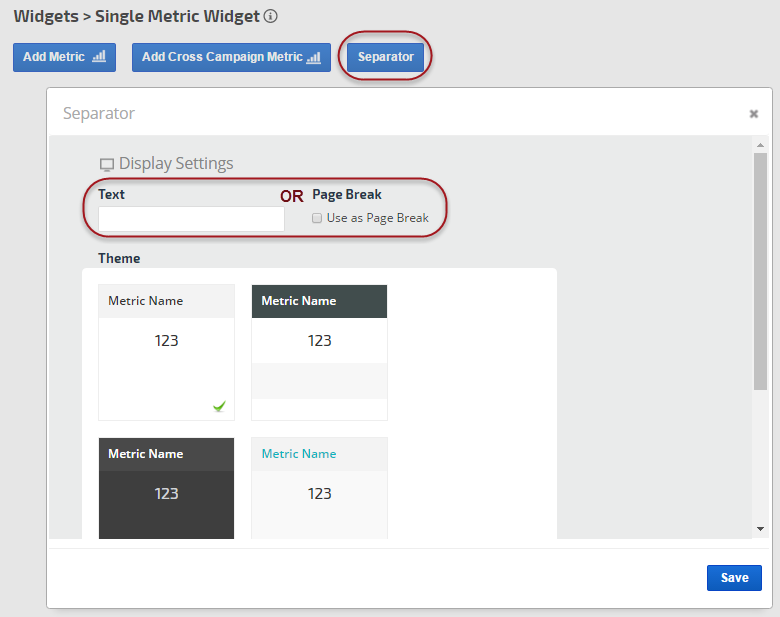
Separators span the width of the page and can be used to add a title to a section of Single Metric Widgets or to insert a page break for display PDF reports.
Single Metric Widgets in PDF Reports & Web Dashboard
When you have finished working on the Single Metric Widget(s), you can easily add your creation to a White Label Scheduled PDF Report or Marketing Dashboard page by hovering over the gear icon and selecting the desired option, and then select the date settings you want to be used in the PDF or dashboard.
When you have finished working on the Single Metric Widget(s), you can easily add your creation to a White Label Scheduled PDF Report or Marketing Dashboard page by hovering over the gear icon and selecting the desired option, and then select the date settings you want to be used in the PDF or dashboard.
Metric Widget Settings for Client Dashboard
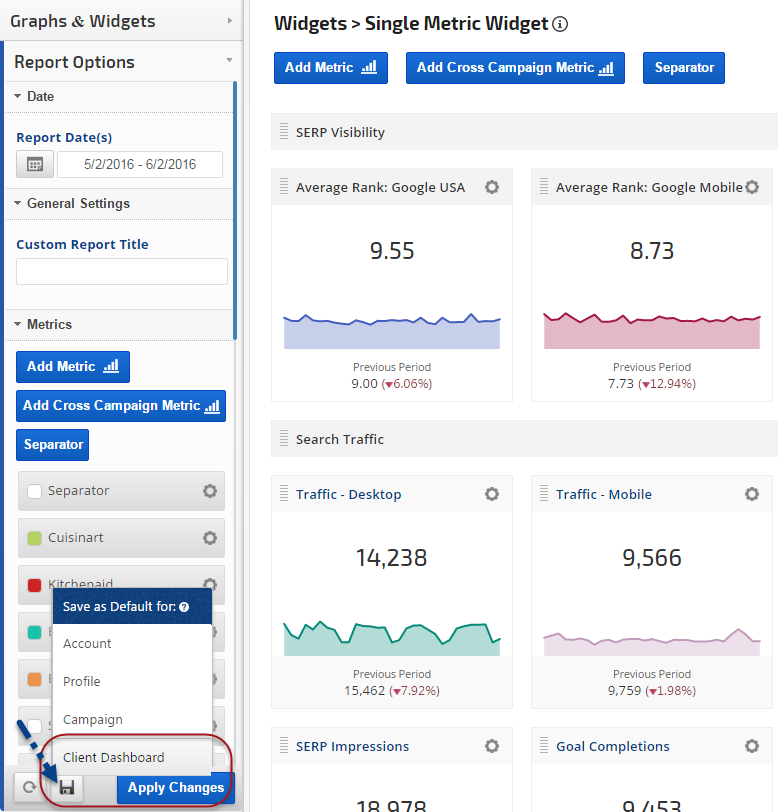
- Open the Graphs & Widgets > Single Metric Widget screen and select the Campaign (upper right corner menu) you want the widget to display in.
- Create one of more Single Metric Widgets and then expand Report Options, hover over the Save As an icon, and select Save as Default for Client Dashboard.
- Open Campaign Settings > Client Dashboard and check the box for Single Metric Widget and click the Save button.
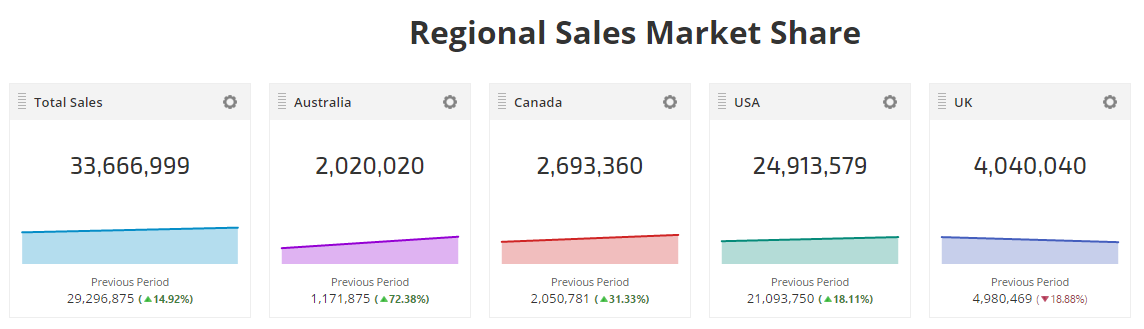
Google Sheets Data in Metric Widgets
Integrate Google Sheets data with marketing metrics in single or multiple Metric Widgets
In this example, we've used Google Sheet data for the total sales vs. sales per region compared to previous period.
Series of Metric Widgets
The first step to creating widgets using data from a Google Sheet is to authorize a Google Drive account and connect it to a campaign.
Add Google Sheets Metric
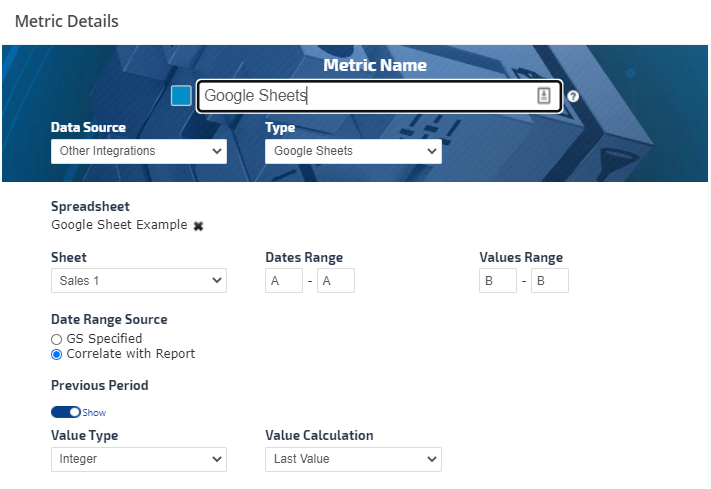
Open Reports & Tools > Custom Suite > Metric Widget, click the Add New Metric button and select:
Select the Sheet name from the menu (each tab in Google Sheets has a label name, e.g., Sheet1, Sheet 2, or user assigned custom names).
There are two options on how the data to be retrieved from the Google Sheet depending on the Data Range Source selection:
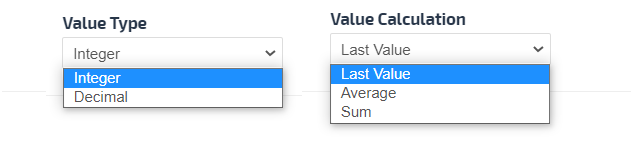
By default Value Type is set to be an integer and there is an option to display the decimal points.
The Value Calculation is set to be Last Value in the specified Values Range. The additional options are to calculate the Average and Sum of the specified Values Range.
Important! Dates must be entered in the Google Sheet as numbers only (e.g., MM/DD/YYYY) regardless of the display format when viewing Google Sheets.
Example of Google Sheet Specified Data Range Source
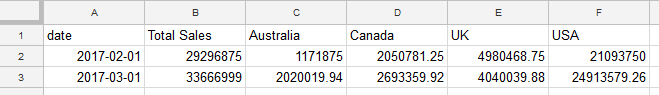
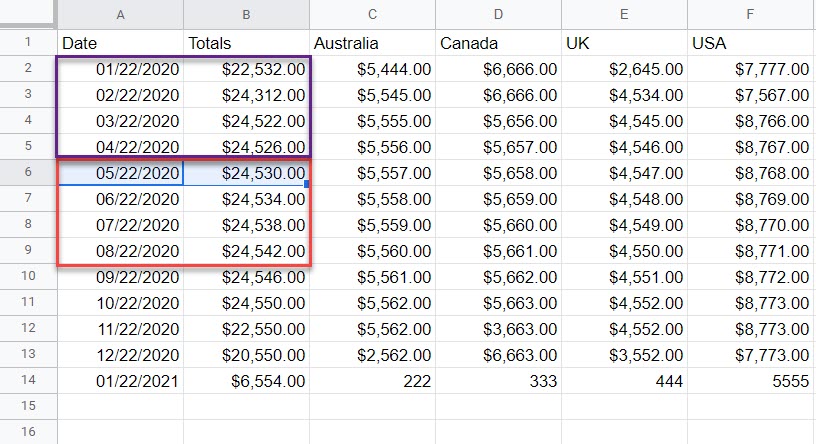
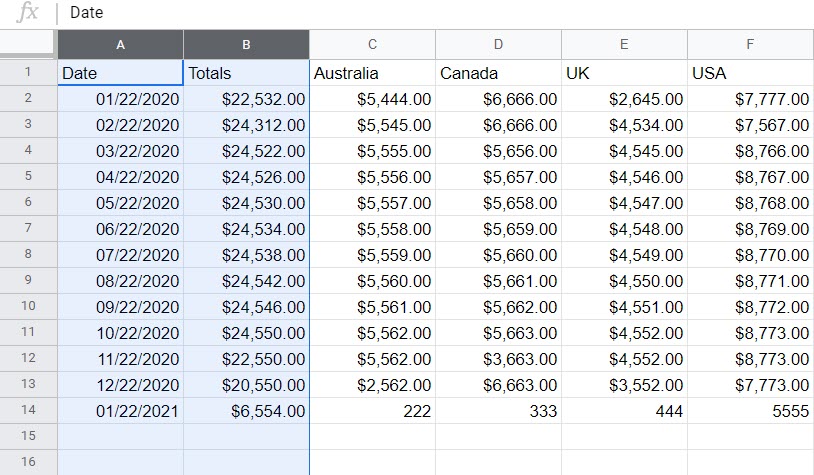
Using the following Google Sheet example, the Metric settings in the previous image correspond to a Date Range from cells A2 - A3; February - March 2017, and Regional Sales for Australia from cells C2 - C3. By default latest date in the series entered determines the current data unless Value Calculation is defined as an Average or a Sum.
Previous Period need to be switched on and the Sheet name, Compare to Date and Compare to Value Ranges have to be specified.
Google Sheet document can be all in one Sheet or you can use different Sheets.
Refer to Metric Display Settings to learn more about color and theme options.
Troubleshooting Google Sheets data in Metric Widgets
If the Google Sheet data does not appear on the screen at all:
The first step to creating widgets using data from a Google Sheet is to authorize a Google Drive account and connect it to a campaign.
Add Google Sheets Metric
Open Reports & Tools > Custom Suite > Metric Widget, click the Add New Metric button and select:
- Data Source: Other Integrations
- Type: Google Sheets In the Spreadsheet field, copy and paste the URL of the Google Sheet containing the data
Select the Sheet name from the menu (each tab in Google Sheets has a label name, e.g., Sheet1, Sheet 2, or user assigned custom names).
There are two options on how the data to be retrieved from the Google Sheet depending on the Data Range Source selection:
- GS Specified (Google Sheet Specified - where the exact cell location from the Google Sheet to be specified for the Dates Range and Values Range of the current and Previous Period)
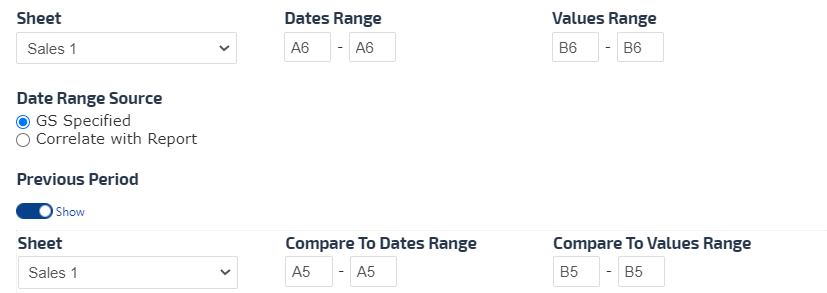
- Dates Range - Enter the start cell and end cell that contain the dates, for example for current A6-A9 and for the Previous Period A2-A5 or just one cell as an example in the image below.
- Values Range - Enter the start cell and end cell that contain the values, for example for current B6-B9 and for the Previous Period B2-B5 or just one cell as an example in the image below.
- Correlated with Report (The dates are matched to the Metric Widget Date Range selected in the report and data dynamically changes when the report data range is changed. Previous Period Date and Value Ranges are not available because they will be automatically retrieved based on the report date range specified).
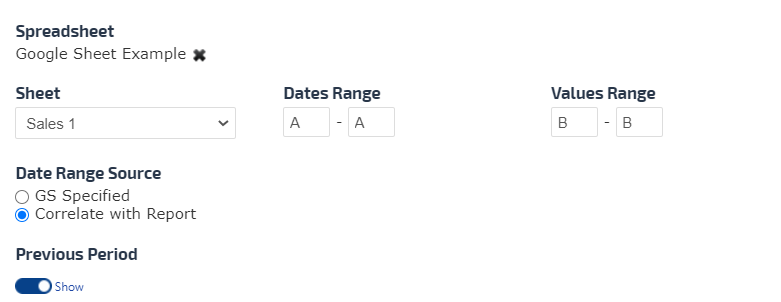
Note: The Correlated with Report Data Source allows the Marketing Dashboard Metric Widget to change when the months change.
- Dates Range - The recommended selection should be a letter of the column for both start and end cell in order to capture the future populated dates, for example A
- Values Range - The recommended selection should be a letter of the column for both start and end cell in order to capture the future populated values, for example B
By default Value Type is set to be an integer and there is an option to display the decimal points.
The Value Calculation is set to be Last Value in the specified Values Range. The additional options are to calculate the Average and Sum of the specified Values Range.
Important! Dates must be entered in the Google Sheet as numbers only (e.g., MM/DD/YYYY) regardless of the display format when viewing Google Sheets.
Example of Google Sheet Specified Data Range Source
Using the following Google Sheet example, the Metric settings in the previous image correspond to a Date Range from cells A2 - A3; February - March 2017, and Regional Sales for Australia from cells C2 - C3. By default latest date in the series entered determines the current data unless Value Calculation is defined as an Average or a Sum.
Previous Period need to be switched on and the Sheet name, Compare to Date and Compare to Value Ranges have to be specified.
Google Sheet document can be all in one Sheet or you can use different Sheets.
Refer to Metric Display Settings to learn more about color and theme options.
Troubleshooting Google Sheets data in Metric Widgets
If the Google Sheet data does not appear on the screen at all:
- Confirm that the campaign is connected the Google Drive account that the Sheet is located in.
- Confirm that the connected Google account has not exceeded Google's Service Quota. Every time you or anyone you've shared online reports with loads or refreshes a screen, the data is called from Google's API. Therefore, we recommend only using Google Sheets for data that is not available in Rank Ranger via the variety of integrations that we offer.
- If you see a 0 or a flat line at the 0 position for dates that do have data in your Google Sheet, that means that the selected range of values in the metric is incorrect and you need to replace it with the correct column and row references.
- If the Google Sheet that you originally referenced in a metric has been modified in such a way that row numbers or column letters changed, then you need to update each metric previously added in Rank Ranger to match the new data structure (e.g., if you referenced data in Value Range B1:B12 and then inserted a column to the left of column B that changes it to column C, then you need to change the Value Range to C1:C12 in your Rank Ranger metrics).
- Share that Google Sheet with service@rankranger.com and
- Send an email to service@rankranger.com with the campaign name and Metric Widget location, for example:
- Campaign Single Metric Widgets report screen
- Marketing Dashboard, along with page name and Metric Widget custom title
- Client Dashboard
- PDF Report name, along with Metric Widget custom title
- Include screenshots or video of a specific behavior you experienced, if possible