The Facebook Insights Posts report offers an overall and itemized look at the performance of the posts made to the Facebook page. The data available here presents insights into post performance trends that can be broken down by traffic source. Additionally, the report gives you a post-by-post performance itemization.
The Posts Performance table is limited to the most recent 10 Facebook posts for the time period selected. Facebook's API limits the request to a maximum of 90 days of data, if you select a longer date range, they may not provide Reach, Clicks and/or Shares data.
Important! In order to view this report, you must authorize a connection to a Facebook account that has Admin permissions for a Facebook Page.
Facebook limits the amount of data available via their API to 90 days. We follow Facebook's best practices in order to provide the reporting that they allow. We review third-party developer API changes monthly, so if they change the rules to allow for a longer reporting period, we'll update our reports accordingly.
- SEO
- Rank Tracker
- Local SEO
- Mobile SEO
- Link Manager
- Landing Pages
- Social Signals
- On-Page Optimization
- Enterprise SEO Solutions
- Marketing
- Competition Analysis
- Insight Graph
- Keyword Research
- Graphs & Widgets
- Market Reach
- Marketing KPI
- Brand Visibility
- White Label SEO
- Marketing Dashboard
- Client Dashboard
- PDF Reports
- PDF Templates
- Other
- Email Notifications
- Portfolio Management
- Integrations
- Google Analytics
- Search Console
- Pay Per Click
- WeDevelop
- API
Facebook Insights Posts
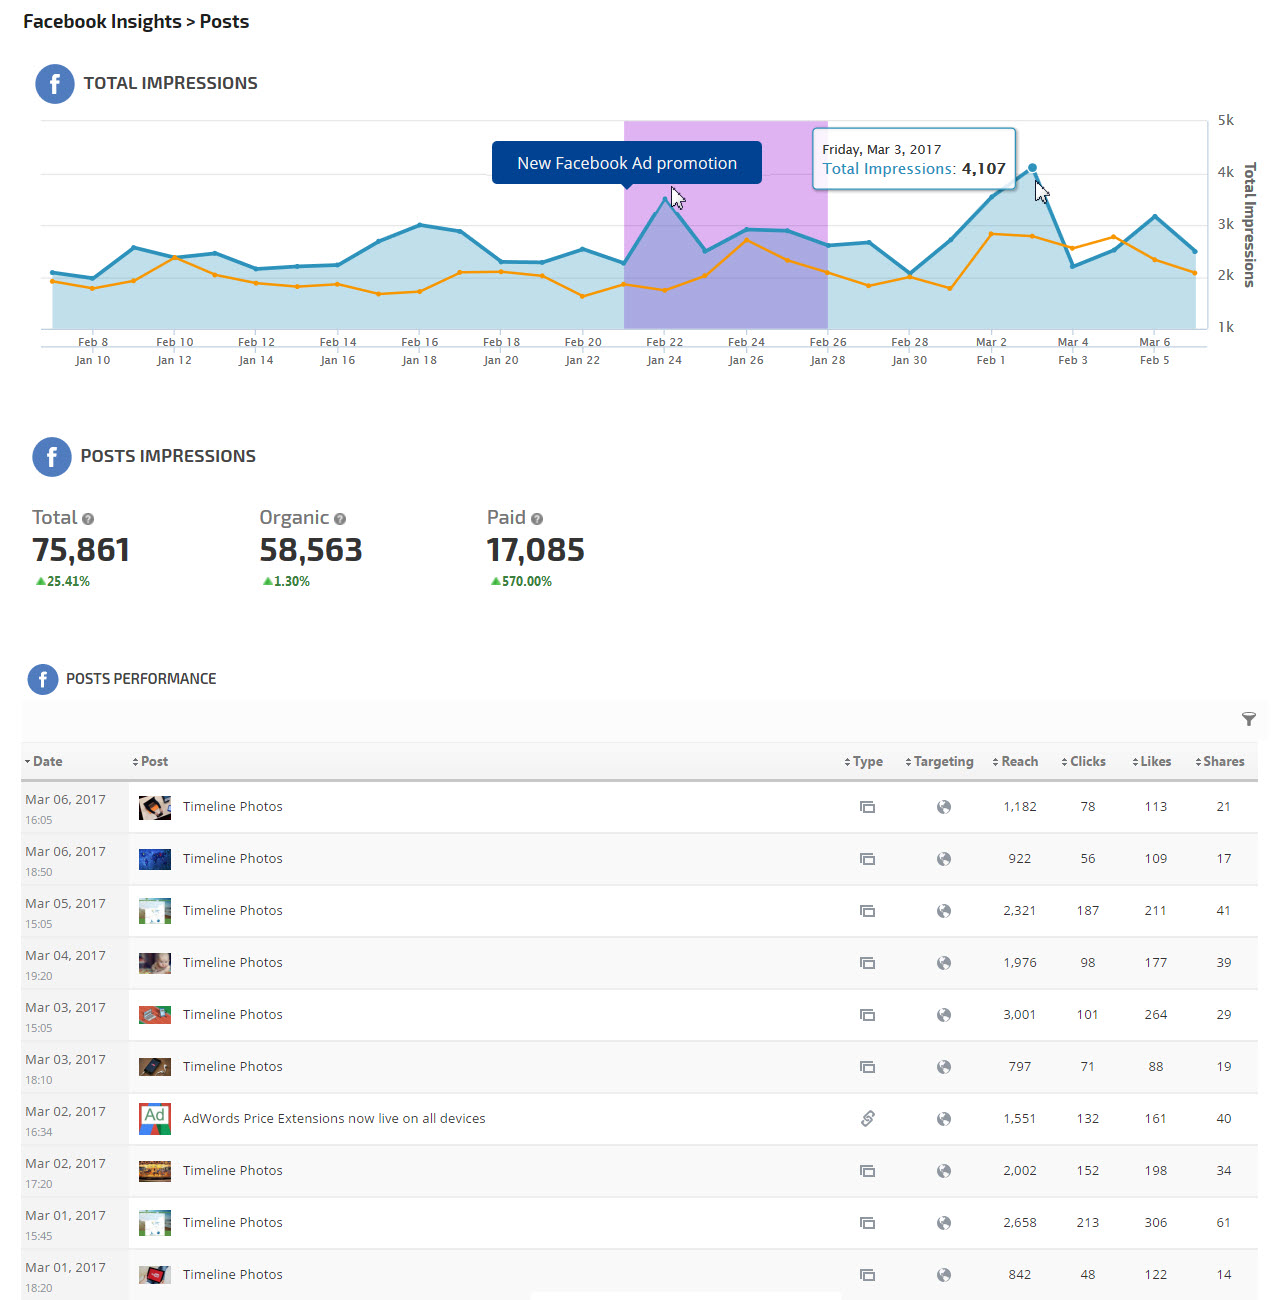
Providing insights into the daily impressions that Page posts have achieved, the Key Metric Graph can be used to analyze trends per traffic source. The graph can be set to either show Total Impressions, Organic Impressions, or Paid Impressions.
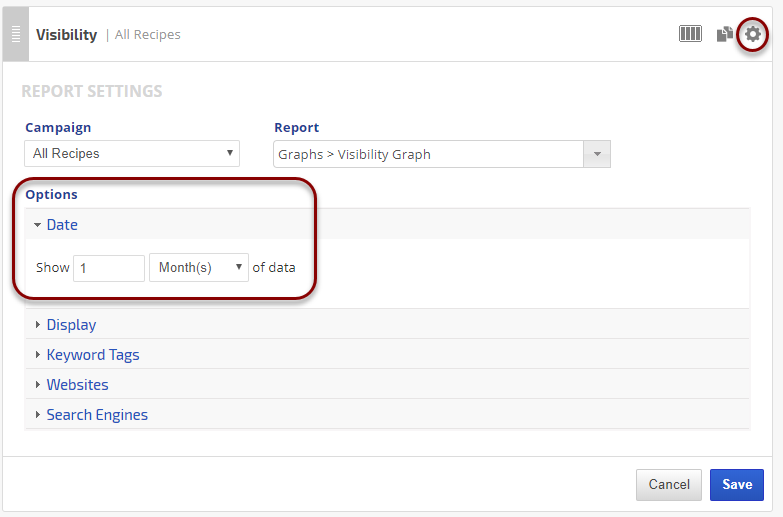
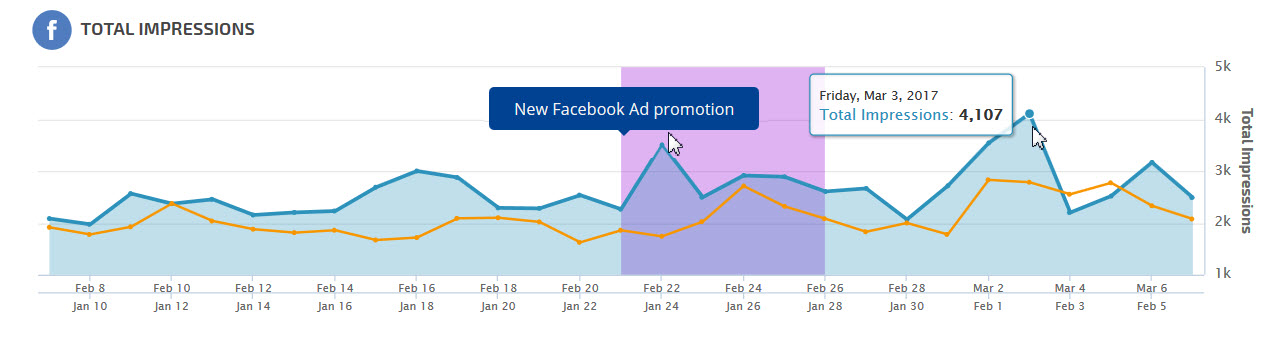 The graph can be set to display based on a custom time period and can reflect previous period data on the same axis (Report Options > Date settings), as well as Events (multiple day) or Notes (single day).
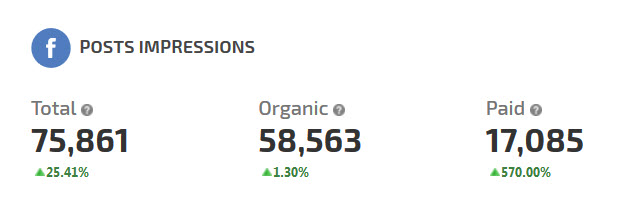
The Metric Totals section provides aggregate Facebook Page Post Impressions statistics. Displayed as numeric values, the report section shows the total impressions, along with segmentation of organic and paid impressions (if applicable).
 Comparison of stats for the report period vs. a previous period can be accomplished by selecting Compare to Previous Period feature in Report Options > Date settings.
The Posts Performance table displays per post engagement data for up to 10 of the most recent posts on the tracked Facebook Page within the selected reporting period.
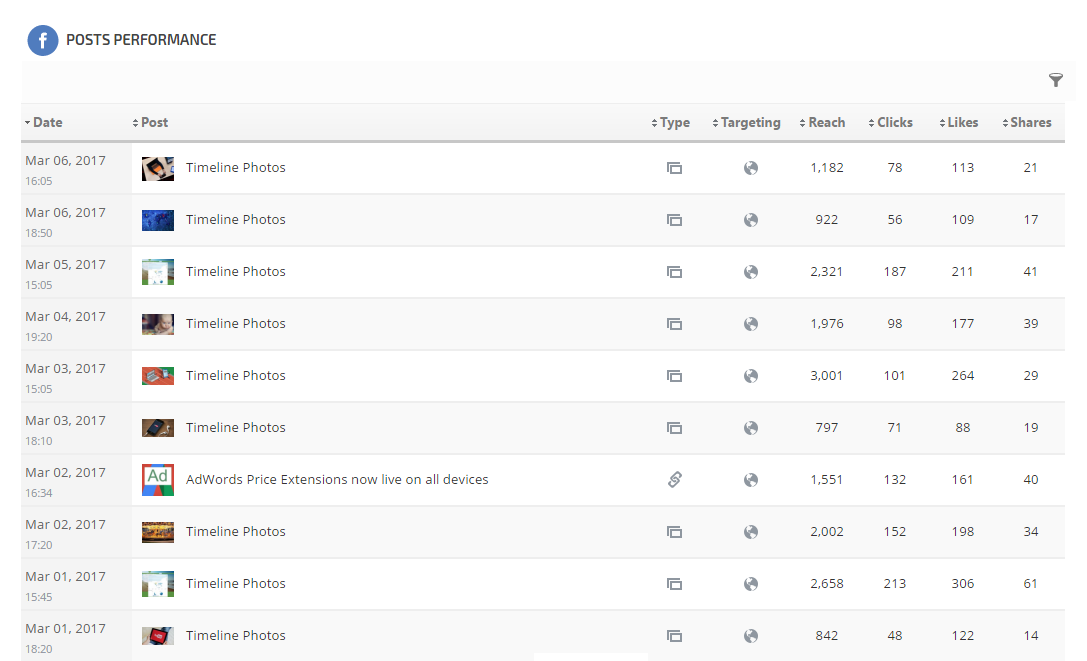
For each post, the table displays:
For each post, the table displays:
- The date and time of posting
- A thumbnail image of the photo or graphic associated with the post (if applicable), along with a post title or excerpt
- Type of post, e.g., link, photo, event, etc.
- Targeting label based on any audience segmentation used for the post (if no segment was selected, then Public displays representing a global audience)
- Metrics related to each post:
- Reach: the number of people who saw any of the Page posts. (Unique Users)
- Clicks: the number of clicks on any of your content. Stories generated without clicks on page content (e.g., liking the page in Timeline) are not included. (Total Count)
- Likes: the number of times people viewed a Page post and clicked Like
- Shares: the number of times people shared a Page post.
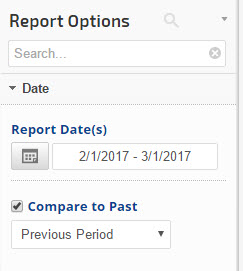 |
Report Dates
|
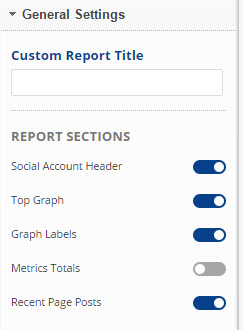 |
General Settings
|
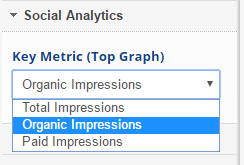 |
Social Analytics
|
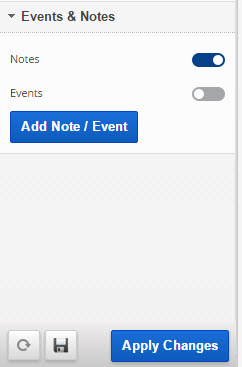 |
Events and Notes:
|
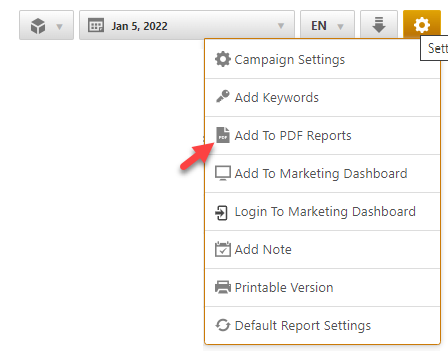
Add to PDF Report
Conveniently add a report or graph with its current settings to a PDF report by hovering over the gold gear icon and selecting Add to PDF Reports
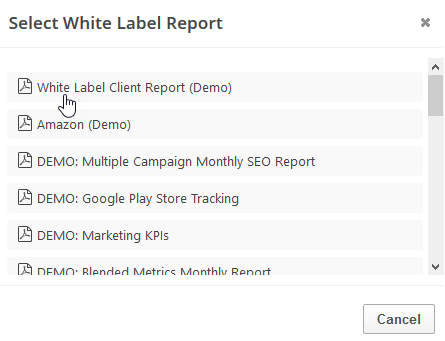
Select the PDF Report that you want the report or graph added to
Drag the new report or graph into the position you want it to display in the PDF and confirm that the Date settings do not conflict with the automated scheduling settings.
Add to Marketing Dashboard
Conveniently add a report or graph with its current settings to a marketing dashboard:
1. Hover over the gold gear icon and select Add to Marketing Dashboard
2. Select the Dashboard (campaign name)
3. Select the Dashboard Page that you want the report added to

1. Hover over the gold gear icon and select Add to Marketing Dashboard
2. Select the Dashboard (campaign name)
3. Select the Dashboard Page that you want the report added to
4. Click the "Go to Dashboard" link to further customize the report (e.g., drag it to a specific position on the page, change date settings, etc.)

Refer to the Report Options section for details regarding the display settings, filters and sort options available for this report.
The report date (or date range) is governed by the selected Dashboard date option: Date Selection or Fixed Periods, learn more...
- Daily reports default to the last day of the selected period
- Weekly and monthly reports default to 1 month of data