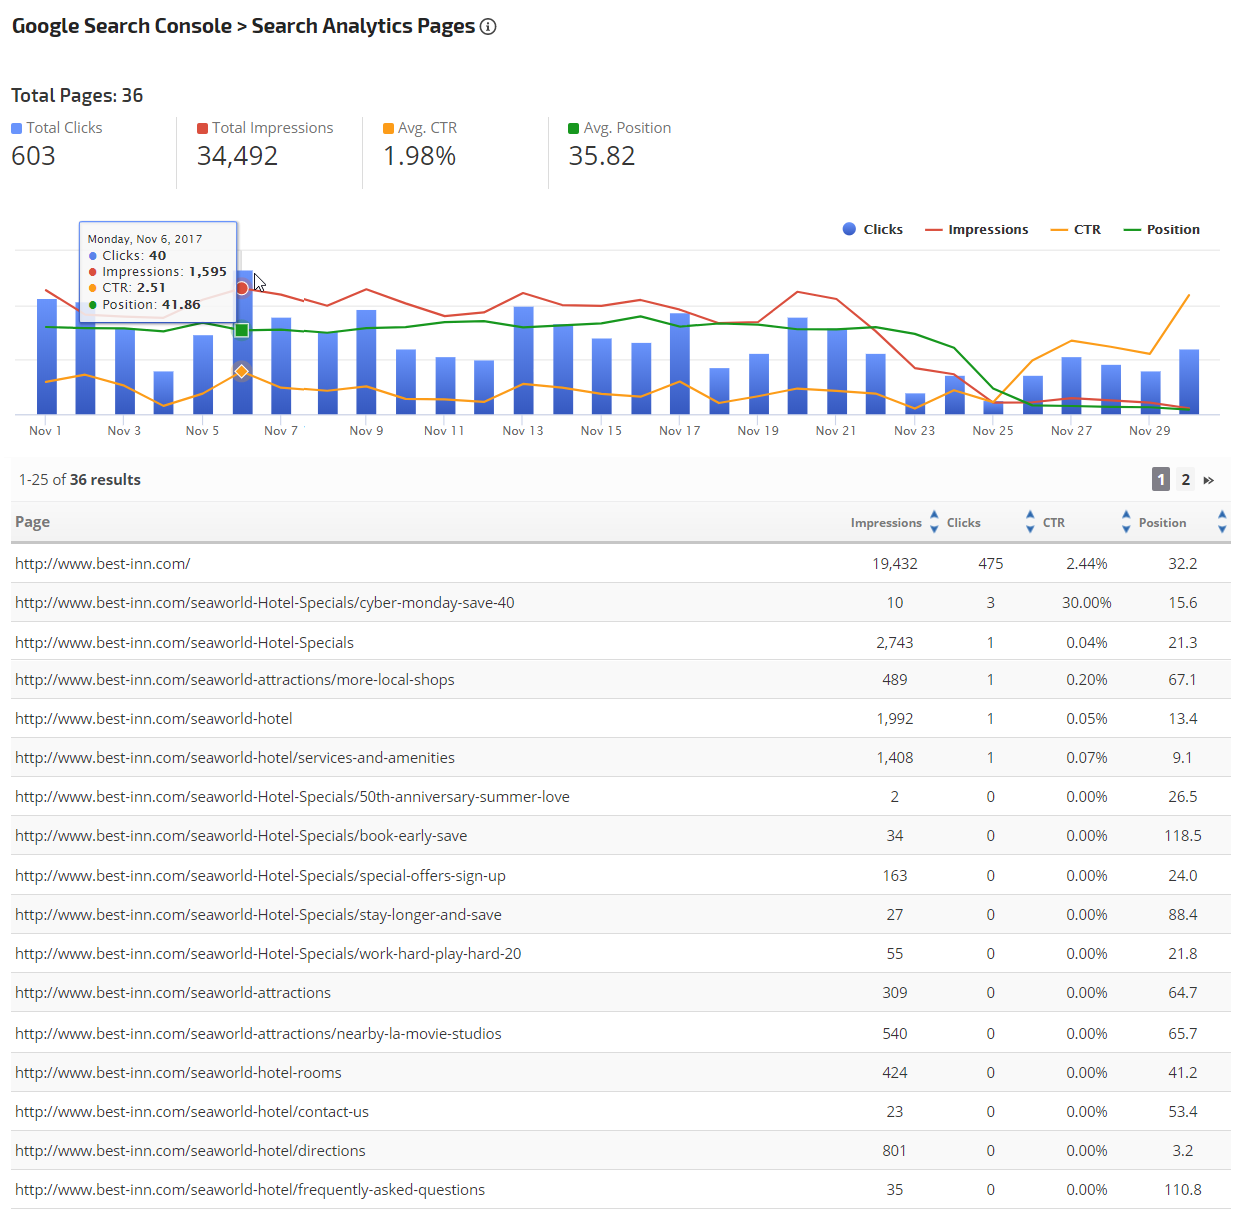
The Search Analytics Pages report
displays a combination graph and table detailing the Pages on
your site that were seen most often in search results. Page URL with
the corresponding number of Impressions, Clicks, Click-thru-Rate, and
Average Position in either Google Web, News, Images, or Videos Search queries are displayed in a sortable table. The multi-axis graph charts the search metrics for each date.
Data provided in this report is filterable by the Search Types(tabs in Google Search): Web, News, Images, and Videos for all Locations and all Traffic queries. Please note that there can be a 3 to 5-day delay between the time Google compiles and releases this data via their API.
At the present time, Google's data storage policy is restricted to the past 3 months. In Rank Ranger's Campaign Settings > Webmaster Tools, you have the option to allow RangerBot to archive monthly snapshots of your Search Console data for historical comparison in this report.
Important! To view this report Google Webmaster Tools / Search Console must be configured correctly, please refer to Rank Ranger's Search Console documentation.
- SEO
- Rank Tracker
- Local SEO
- Mobile SEO
- Link Manager
- Landing Pages
- Social Signals
- On-Page Optimization
- Enterprise SEO Solutions
- Marketing
- Competition Analysis
- Insight Graph
- Keyword Research
- Graphs & Widgets
- Market Reach
- Marketing KPI
- Brand Visibility
- White Label SEO
- Marketing Dashboard
- Client Dashboard
- PDF Reports
- PDF Templates
- Other
- Email Notifications
- Portfolio Management
- Integrations
- Google Analytics
- Search Console
- Pay Per Click
- WeDevelop
- API
Google Search Console Search Analytics Pages
Google Search Console Search Analytics Pages Report
Search Analytics Total Queries and Graph
While viewing the graph, you can hover over any point to view the number of Impressions, Clicks, CTR, and Average Position for a specific date.
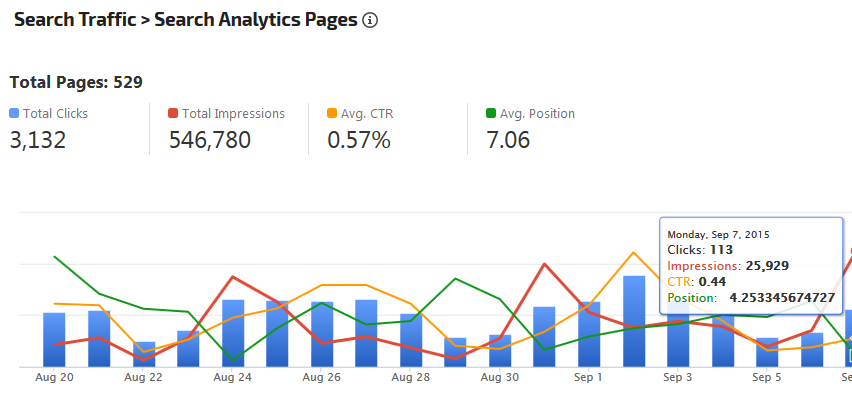
While viewing the graph, you can hover over any point to view the number of Impressions, Clicks, CTR, and Average Position for a specific date.
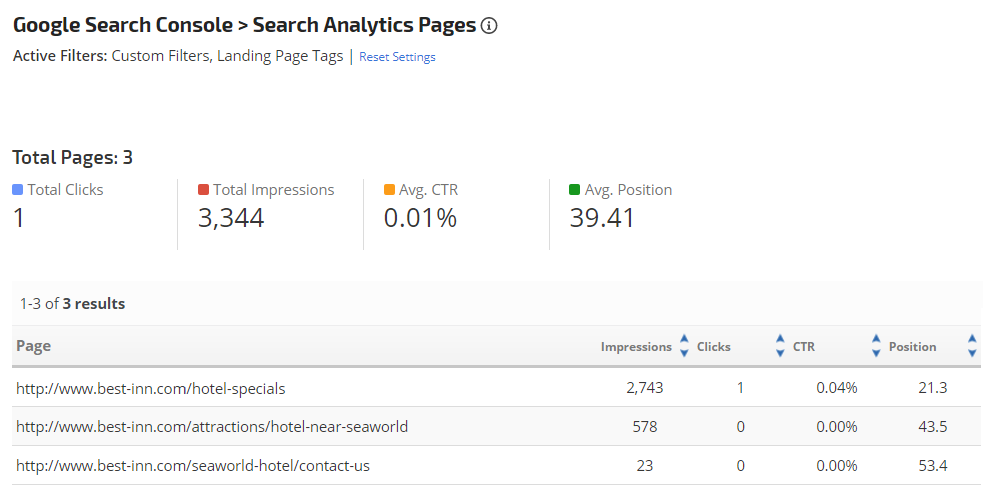
Landing Page with Column Sorting
You can click the arrows at the top of the Impressions, Clicks, CTR, and Position columns to change the sort to ascending or descending order. The default sort column is Clicks.
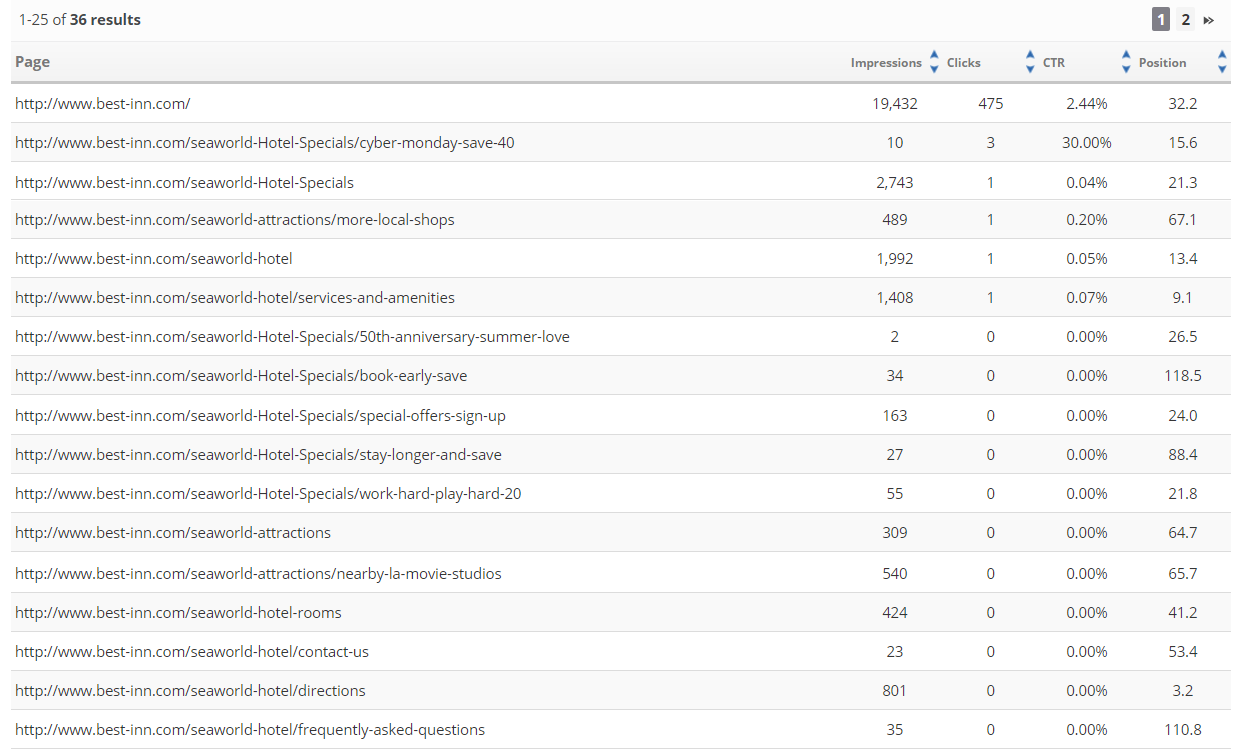
You can click the arrows at the top of the Impressions, Clicks, CTR, and Position columns to change the sort to ascending or descending order. The default sort column is Clicks.
In this example, directly below the title, the Active Filters (refer to Report Options) are listed, with a quick Reset Settings option that clears the filters and generates the report with default settings.
In addition to a custom filter set to "Page contains 'hotel'", Landing Page Tags were utilized to define a specific set of site pages. Landing Page Tags are available only in Enterprise-level packages.
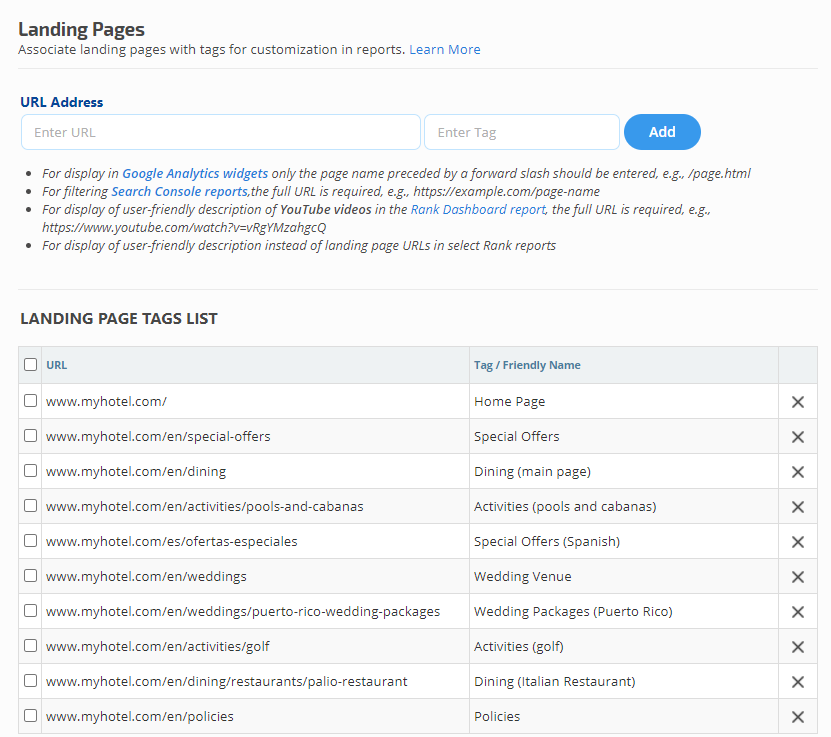
Campaign Settings > Landing Pages
Landing Page Tags can be imported in the Campaign Settings > Landing Page screen, and are useful for sites that have content relating to a specific location or topic spread across multiple directories. You may add landing pages that exist in the primary domain being tracked in the campaign, along with tags for grouping those pages.
Landing Page Tags Settings
In the Campaign Settings > Landing Pages screen:
In the Campaign Settings > Landing Pages screen:
- URL Address: enter the full URL, e.g., https://example.com/page-name
- Enter Tag: enter a Tag / Friendly Name for the URL as you want it displayed in the report options
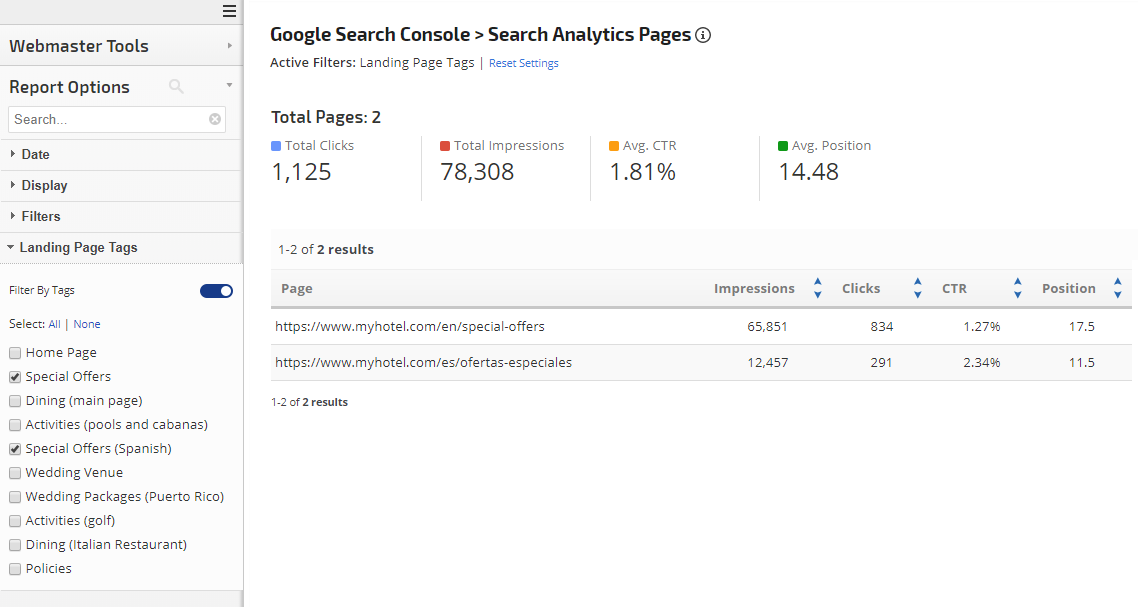
Search Console Search Analytics Pages Report
After associating URLs with Tags, you can filter this report by Tag(s) to only display the URLs you want to be listed in the report. When the Landing Page Tags filter is enabled the chart is intentionally disabled because the filter will not apply to the chart.
After associating URLs with Tags, you can filter this report by Tag(s) to only display the URLs you want to be listed in the report. When the Landing Page Tags filter is enabled the chart is intentionally disabled because the filter will not apply to the chart.
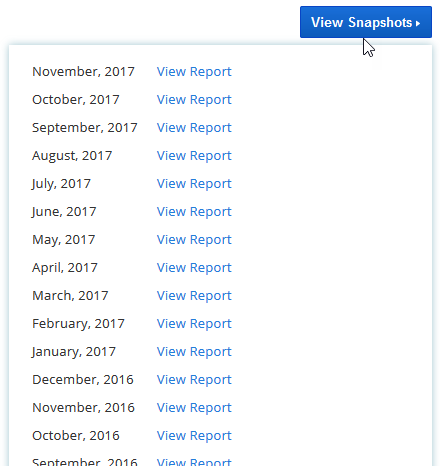
If in the campaign's Search Console settings you have selected the option that enables RangerBot to archive monthly snapshots of your Search Console data, then in the top right corner of this report you will see the View Snapshots option that allows you to select and view data from previous months. That Historical Data Storage option causes the following Search Console data to be stored based on calendar months without filters:
- Daily totals for Clicks, Impressions, CTR, and Position
- Unfiltered Keyword totals for up to 5000 queries
- Unfiltered Landing Page totals for up to 5000 pages
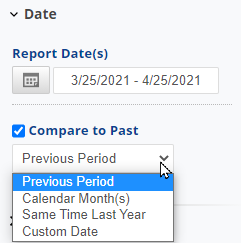 |
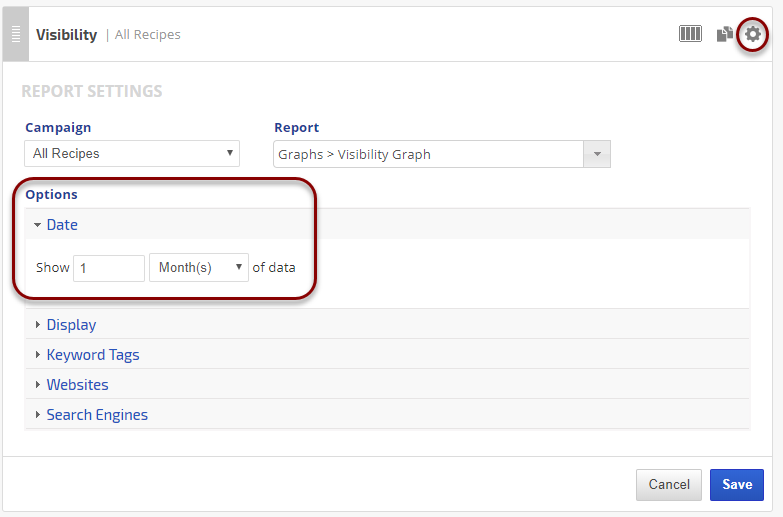
Date:
|
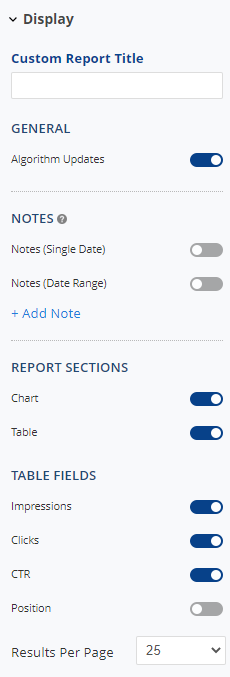 |
Display Settings:
Table Fields:
Results Per Page:
|
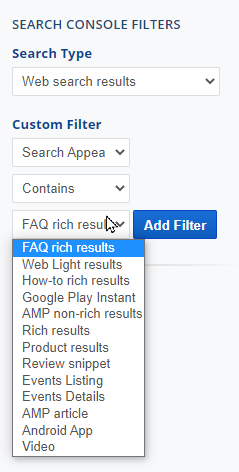 |
Search Console Filters (optional):These filters can only be applied to the current month because previous months are stored as snapshots only.
|
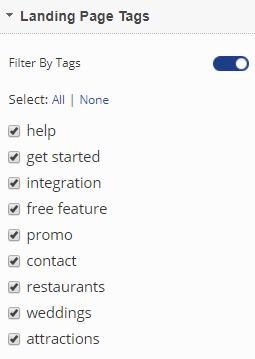 |
Landing Page Tags:To utilize this feature, a list of primary domain URLs with Tags must be present in the Campaign Settings > Landing Pages screen.
Note: * Landing Page Tags are available only in Enterprise level packages, contact customer service if you want to upgrade your package. * When the Landing Page Tags filter is enabled the chart is disabled. |
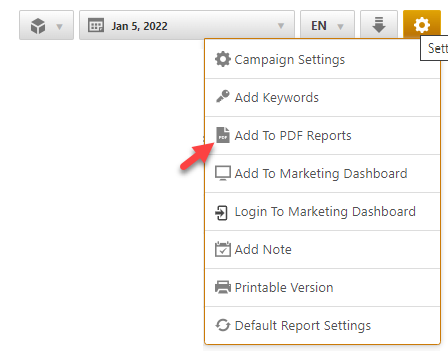
Add to PDF Report
Conveniently add a report or graph with its current settings to a PDF report by hovering over the gold gear icon and selecting Add to PDF Reports
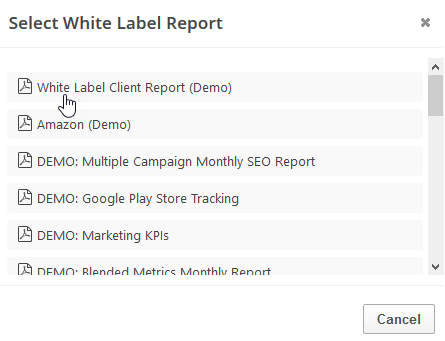
Select the PDF Report that you want the report or graph added to
Drag the new report or graph into the position you want it to display in the PDF and confirm that the Date settings do not conflict with the automated scheduling settings.
Add to Marketing Dashboard
Conveniently add a report or graph with its current settings to a marketing dashboard:
1. Hover over the gold gear icon and select Add to Marketing Dashboard
2. Select the Dashboard (campaign name)
3. Select the Dashboard Page that you want the report added to

1. Hover over the gold gear icon and select Add to Marketing Dashboard
2. Select the Dashboard (campaign name)
3. Select the Dashboard Page that you want the report added to
4. Click the "Go to Dashboard" link to further customize the report (e.g., drag it to a specific position on the page, change date settings, etc.)

Refer to the Report Options section for details regarding the display settings, filters and sort options available for this report.
The report date (or date range) is governed by the selected Dashboard date option: Date Selection or Fixed Periods, learn more...
- Daily reports default to the last day of the selected period
- Weekly and monthly reports default to 1 month of data