The Daily Snapshot by Tags report is a feature available in Enterprise packages. It provides a summary of daily rank by keyword tag groupings. This report utilizes the Average Weighted Rank based on search volume and the rank of the individual keywords within the tag group. When viewing the report, you can drill down to the keyword list with individual rank trends by clicking the tag name.
Important! Learn more about types of Tags and how to enable and set up Tag Manager for this report.
- SEO
- Rank Tracker
- Local SEO
- Mobile SEO
- Link Manager
- Landing Pages
- Social Signals
- On-Page Optimization
- Enterprise SEO Solutions
- Marketing
- Competition Analysis
- Insight Graph
- Keyword Research
- Graphs & Widgets
- Market Reach
- Marketing KPI
- Brand Visibility
- White Label SEO
- Marketing Dashboard
- Client Dashboard
- PDF Reports
- PDF Templates
- Other
- Email Notifications
- Portfolio Management
- Integrations
- Google Analytics
- Search Console
- Pay Per Click
- WeDevelop
- API
Daily Snapshot by Tag
Reports & Tools > Organic Search> Rank Tracking > Rank Trends
Daily Snapshot by Tag Report
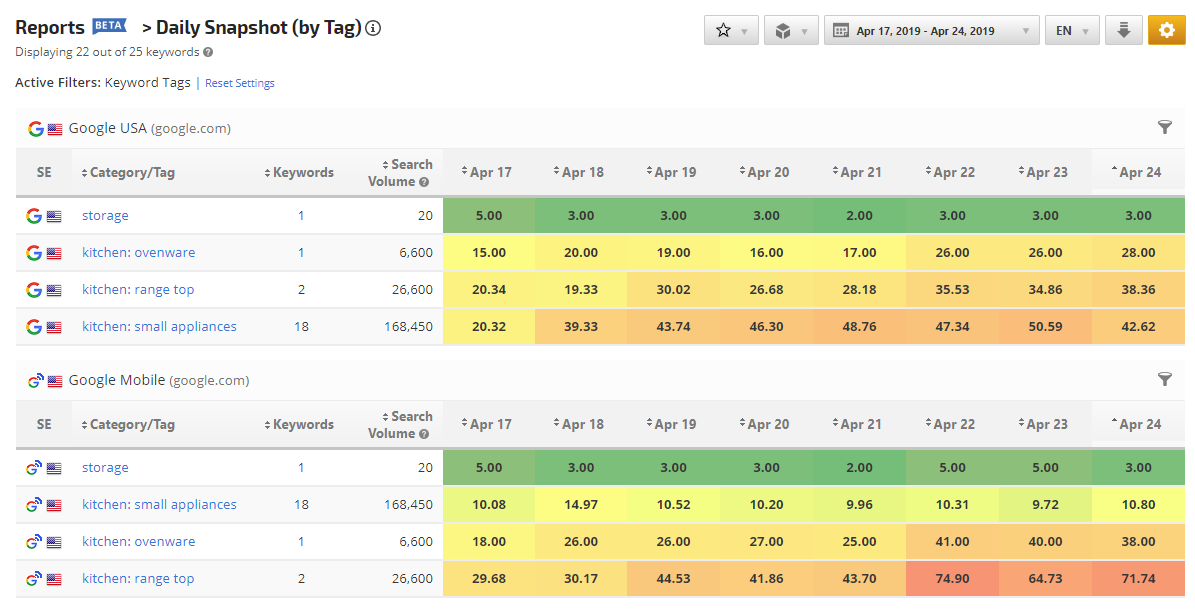
This report provides the category/tag name, a number of keywords in that group (this can be altered in the Keywords section of report options if keywords are unchecked), search volume, and average weighted rank per day (refer to the "How Average Weighted Rank is Calculated" section below for more information).
This report provides the category/tag name, a number of keywords in that group (this can be altered in the Keywords section of report options if keywords are unchecked), search volume, and average weighted rank per day (refer to the "How Average Weighted Rank is Calculated" section below for more information).
Drill Down to Daily Snapshot
Clicking the name of a Category/Tag in the Daily Snapshot by Tag report launches the Daily Snapshot report with the list of keywords (and their actual non-weighted rank) for the tag.
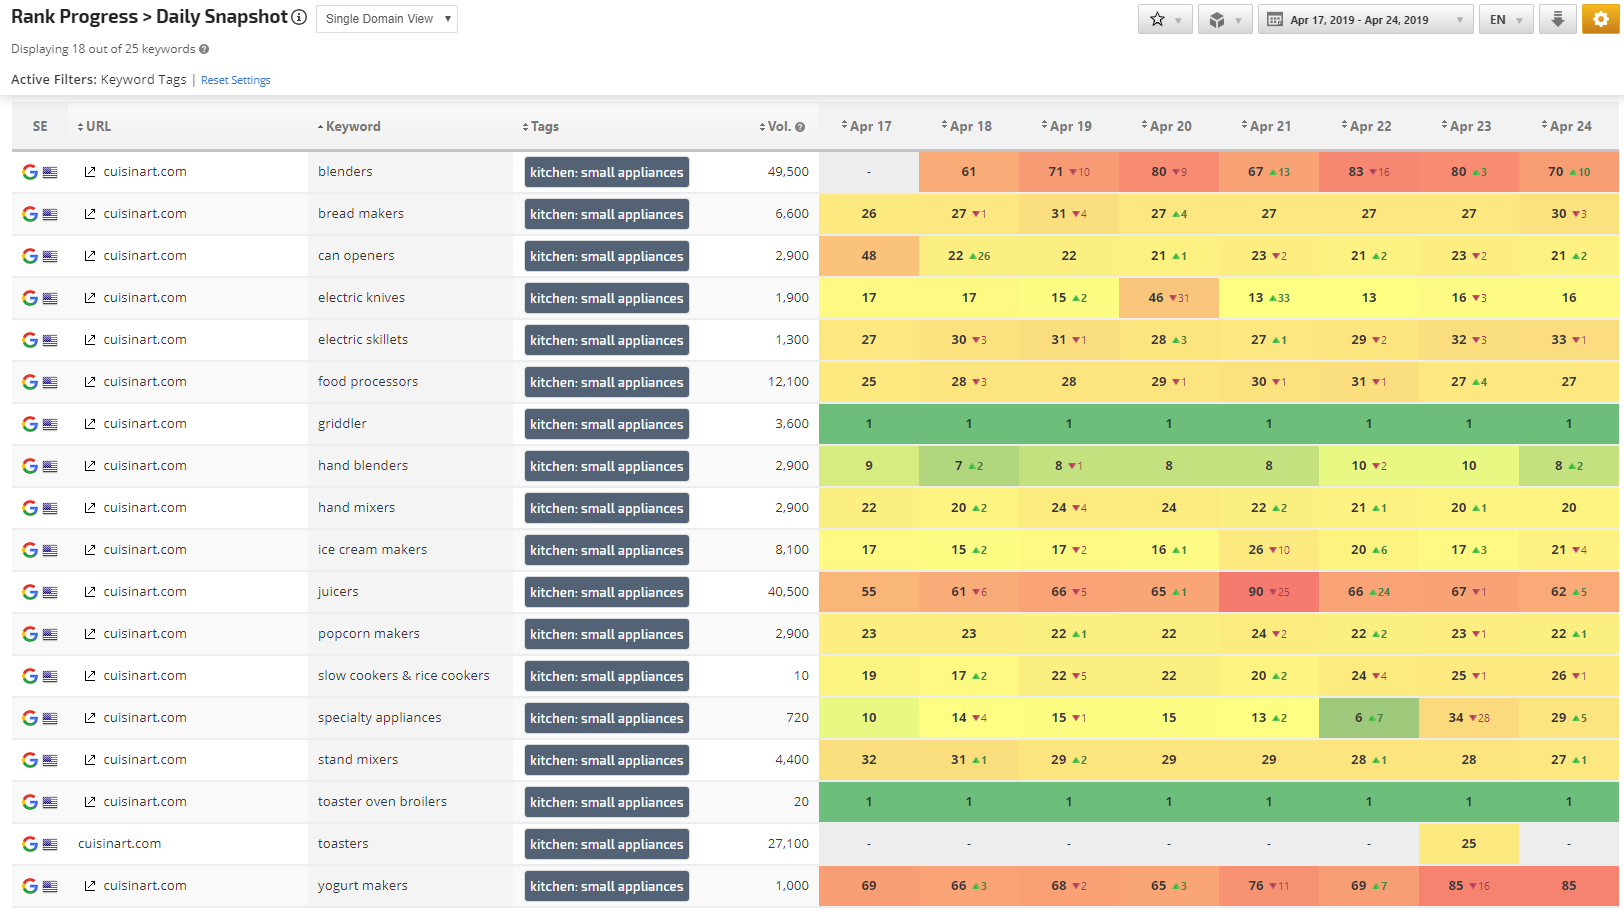
Clicking the name of a Category/Tag in the Daily Snapshot by Tag report launches the Daily Snapshot report with the list of keywords (and their actual non-weighted rank) for the tag.
 |
Dates
|
|
|
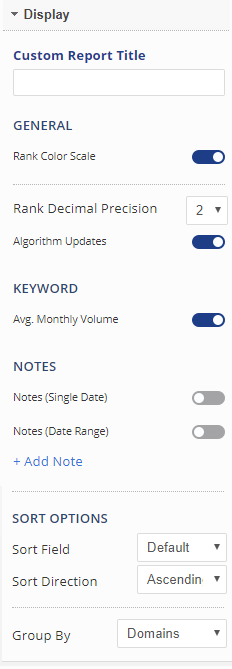
Display
|
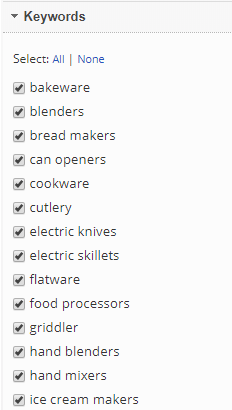 |
Keywords
|
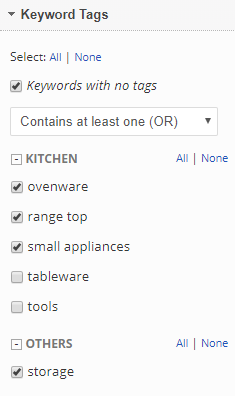 |
Keyword Tags
|
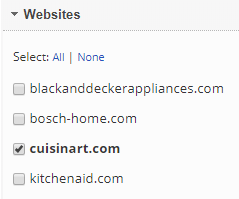 |
Websites
|
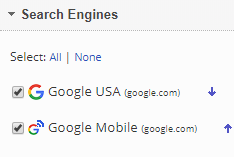 |
Search Engines
|
Average Weighted Rank Calculation
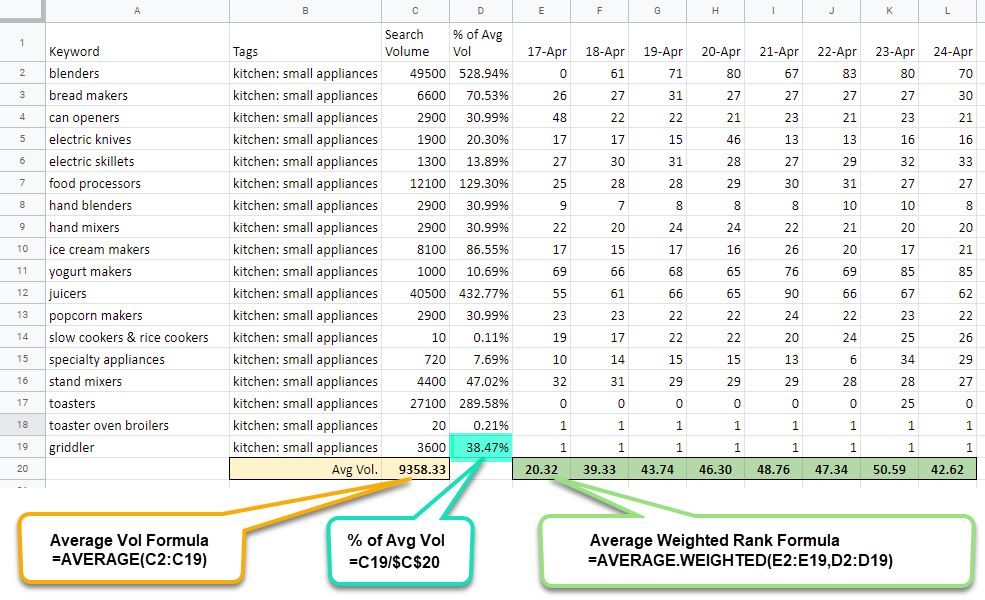
Average Weighted Formula
This formula can be found in Google Sheets. For the purpose of our Daily and Monthly Snapshot by Tags reports, there are 3 calculations run:
This formula can be found in Google Sheets. For the purpose of our Daily and Monthly Snapshot by Tags reports, there are 3 calculations run:
- Average Volume: the average of the search volume for all keywords in the tag group
- % of Avg. Volume: each keyword's search volume percentage of the Average Volume
- Average Weighted Rank: utilizes the Average Weighted formula taking into account the rank for all keywords in the tag group and percentage of average volume.
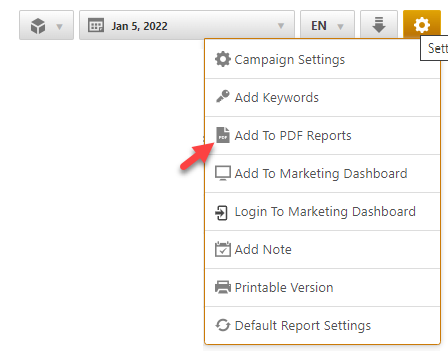
Add to PDF Report
Conveniently add a report or graph with its current settings to a PDF report by hovering over the gold gear icon and selecting Add to PDF Reports
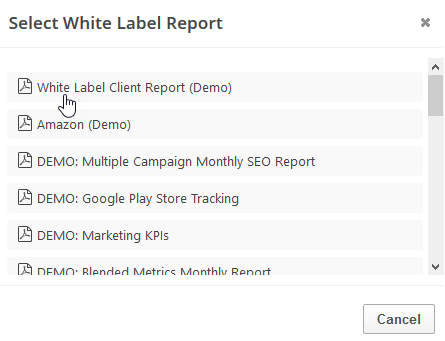
Select the PDF Report that you want the report or graph added to
Drag the new report or graph into the position you want it to display in the PDF and confirm that the Date settings do not conflict with the automated scheduling settings.
Add to Marketing Dashboard
Conveniently add a report or graph with its current settings to a marketing dashboard:
1. Hover over the gold gear icon and select Add to Marketing Dashboard
2. Select the Dashboard (campaign name)
3. Select the Dashboard Page that you want the report added to

1. Hover over the gold gear icon and select Add to Marketing Dashboard
2. Select the Dashboard (campaign name)
3. Select the Dashboard Page that you want the report added to
4. Click the "Go to Dashboard" link to further customize the report (e.g., drag it to a specific position on the page, change date settings, etc.)

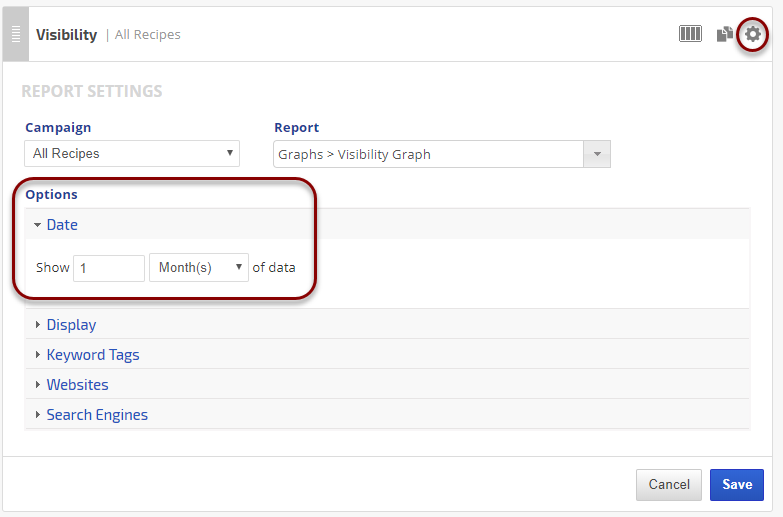
Refer to the Report Options section for details regarding the display settings, filters and sort options available for this report.
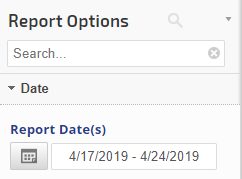
The report date (or date range) is governed by the selected Dashboard date option: Date Selection or Fixed Periods, learn more...
- Daily reports default to the last day of the selected period
- Weekly and monthly reports default to 1 month of data