Search our Knowledge Base
Search

Portfolio Average Rank & Visibility Score Report


Use the Enterprise Portfolio Report to view and compare baseline and current average rank & visibility score, along with percentage of change, and current average rank & visibility score per tracked search engine for all campaigns in your account.  
  • Average Rank provides an average of the rank positions of all keywords in a campaign that are ranking in the top 100 search results.
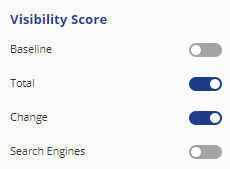
  • Visibility Score is based on the position of ranking keywords and average search volume for all keywords in a campaign, across all search engines.
This report is available in Enterprise accounts after the 5th of every month, displaying the previous month's data.

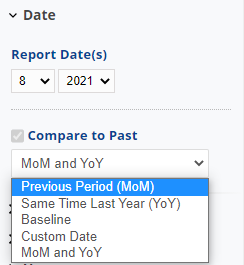
How is Baseline determined?
If a campaign was created in January 2015, then the baseline data will display in this report beginning on February 1, 2015. For campaigns that existed in Rank Ranger before the Portfolio Report was created, baseline data is set as of October 1 (or later if the campaign was created - or Google Analytics or Search Console (Webmaster Tools) was connected to the campaign - after October 1, 2015).
  • Page Rank, Average Rank and Visibility Score are based on the last day of the previous month.
  • Google Analytics and Search Console (Webmaster Tools) data are based on the previous calendar month.
If you have baseline data from a previous time period, Portfolio Report Baseline values can be manually changed in Campaign Settings > Portfolio Baseline.

Portfolio Report Average Rank & Visibility Score


Screenshots

 
Portfolio Report - Average Rank & Visibility Score Report

View and compare baseline and current average rank & visibility score, along with percentage of change, and current average rank & visibility score per tracked search engine for all campaigns in your account.

Average Rank & Visibility Score of Portfolio


Portfolio Report Options

Enter Custom Report Title

Date

  • Select Month and Year
    Compare to Past allows you to compare the data to a previous time period, including:
    • Previous Period (MoM)
    • Same Time Last Year (YoY)
    • Baseline
    • Custom Date
    • MoM and YoY (the table will display two columns for each metric change that is selected to Show.
Enter Custom Report Title

Custom Report Title

  • Enter a custom title to display at the top of your report (optional)
    This title will also display in your PDF reports, both at the top of the report and within the table of contents.
Campaign Details

Display

Deselect all columns: is an option to deselect all selected columns and the table will not display in the report.
  • Trend Chart: enable the display of a monthly trend chart at the top of the report
  • Metric Total: enable the display of a section containing the totals for the selected campaigns. This includes the number of campaigns, keywords, keywords ranking on Page 1, Page 2 & Page 3, average rank, visibility score, traffic (all), new users, traffic (organic), new users (organic), traffic (paid) and new users (paid)
  • Target Values: enable to allow setting of Target Values (e.g., goals) for various performance fields in the report

Campaign Details


  • Create Date: the campaign creation date
  • Campaign Name
  • Campaign URL
  • Keywords # (Baseline): the number of keywords added during campaign creation
  • Keywords #: the number of keywords as of the last day of the report month
  • SEs # (Baseline): the number of search engines added during campaign creation
  • SEs #: the number of Search Engines as of the last day of the report month
Select Total Page Rankings Metrics

Total Page Rankings

All current page rank data in this report is based on the last day of the report month

  • Page 1 (Baseline): the total number of campaign keywords ranking on Page 1 of the SERPs on the day the campaign was created.
  • Page 1 (Current): the total number of campaign keywords ranking on Page 1 of the SERPs (as of the last day of the report month)
  • Page 1 (Change): the percentage of change between the selected option from the "Compare to Past": (Baseline, Previous Period, Same Time Last Year or Custom Date) and the Current number of keywords with Page 1 rank.
  • Page 2 (Baseline): the total number of campaign keywords ranking on Page 2 of the SERPs on the day the campaign was created.
  • Page 2 (Current): the total number of campaign keywords ranking on Page 2 of the SERPs (as of the last day of the report month)
  • Page 2 (Change): the percentage of change between the selected option from the "Compare to Past": (Baseline, Previous Period, Same Time Last Year or Custom Date) and the Current number of keywords with Page 2 rank.
  • Page 3 (Baseline): the total number of campaign keywords ranking on Page 3 of the SERPs on the day the campaign was created.
  • Page 3 (Current): the total number of campaign keywords ranking on Page 3 of the SERPs (as of the last day of the report month)
  • Page 3 (Change): the percentage of change between the selected option from the "Compare to Past": (Baseline, Previous Period, Same Time Last Year or Custom Date) and the Current number of keywords with Page 3 rank
Select Average Rank metrics

Average Rank

  • Baseline: the average rank of all campaign keywords on all search engines tracked in the campaign on the day the campaign was created
  • Total: the average rank of all campaign keywords on all search engines tracked in the campaign on the last day of the report month
  • Change: the percentage of change between the selected option from the "Compare to Past": (Baseline, Previous Period, Same Time Last Year or Custom Date) and the Current Average Rank
  • Search Engines: the average rank change percentage for each search engine that the campaign keywords are being tracked on
Select Visibility Score details

Visibility Score

Visibility Score is based on the position of ranking keywords and average search volume

  • Baseline: the visibility score on the day the campaign was created
  • Total: the visibility score on the last day of the report month
  • Change: the percentage of change between the selected option from the "Compare to Past": (Baseline, Previous Period, Same Time Last Year or Custom Date) and the Current total visibility score
  • Search Engines: the visibility score change percentage for each search engine
Select Google Analytics Traffic totals

Google Analytics Totals

Requires Google Analytics integration

  • Traffic (Baseline): traffic for the calendar month based on campaign creation date
  • Traffic (Current): traffic totals for the report month
  • Traffic (Change): the percentage of change between the selected option from the "Compare to Past": (Baseline, Previous Period, Same Time Last Year or Custom Date)  and the Current Traffic
  • New Users (Baseline): the number of new users reported for the calendar month based on the campaign creation date
  • New Users (Current): the number of new users during the report month
  • New Users Change: the percentage of change between the selected option from the "Compare to Past": (Baseline, Previous Period, Same Time Last Year or Custom Date) and the Current user totals
  • Direct Traffic: the number of sessions resulting from a user entering a direct link to the site (e.g., typing or via a bookmark)
  • Referral Traffic: the number of sessions involving a referral link from another site.
  • Bounce Rate: the percentage of single-page visits (i.e., visits in which the user left the site from the same page they entered on without clicking deeper)
  • Goal Completions: the number of times users completed all the elements of a particular goal defined for the site in Google Analytics
  • Goal Value: the total value of completed goals based on the value assigned to each goal in Google Analytics.
  • Transactions: the number of completed transactions.
  • Revenue: the total value of completed transactions.
Select Google Analytics Organic Traffic data

Google Analytics Organic Traffic

Requires Google Analytics integration

  • Traffic (Baseline): organic traffic for the calendar month based on campaign creation date
  • Traffic (Current): organic traffic totals for the report month
  • Traffic (Change): the percentage of change between the selected option from the "Compare to Past": (Baseline, Previous Period, Same Time Last Year or Custom Date) and the Current Organic Traffic
  • New Users (Baseline): the number of new users from organic search for the calendar month based on campaign creation date
  • New Users (Current): the number of new users from the organic search during the report month.
  • New Users (Change) - the percentage of change between the selected option from the "Compare to Past": (Baseline, Previous Period, Same Time Last Year or Custom Date) and the Current Organic User totals
  • All Users (Baseline) - the number of all users from the organic search for the calendar month based on the campaign creation date. 
  • All Users (Current) - the number of all users for the selected report date range.
  • All Users (Change) - the percentage of change between the selected option from the "Compare to Past" in the Date option.
  • Transaction Revenues (Baseline) - the transaction revenue from the organic search for the calendar month based on the campaign creation date.
  • Transaction Revenues (Current) - the transaction revenue of the organic search for the selected report date range.
  • Transaction Revenues (Change) - the percentage of change between the selected option from the "Compare to Past" in the Date option.
Select Google Analytics Paid Traffic data

Google Analytics Paid Traffic

Requires Google Analytics integration

  • Traffic (Baseline): paid traffic for the calendar month based on campaign creation date  
  • Traffic (Current): paid traffic totals for the report month
  • Traffic (Change): the percentage of change between the selected option from the "Compare to Past": (Baseline, Previous Period, Same Time Last Year or Custom Date) and the Current Paid Traffic
  • New Users (Baseline): the number of new users generated from paid traffic for the calendar month based on the campaign creation date
  • New Users (Current): the number of new users generated from paid traffic during the report month
  • New Users (Change): the percentage of change between the selected option from the "Compare to Past": (Baseline, Previous Period, Same Time Last Year or Custom Date) and the Current Paid New User totals 
Select Search Console (Webmaster Tools) metrics

Search Console (Webmaster Tools)

Requires Google Search Console integration

  • Queries (Baseline): the total number of search queries that returned pages from the campaign's primary domain for the  calendar month based on the campaign creation date
  • Queries (Current): the total number of search queries that returned pages from the campaign's primary domain during the report month
  • Queries (Change): the percentage of change between the selected option from the "Compare to Past": (Baseline, Previous Period, Same Time Last Year or Custom Date) and the Current Queries
  • Impressions (Baseline): the number of times pages from the campaign's primary domain appeared in search results for the  calendar month based on the campaign creation date
  • Impressions (Current): the number of times pages from the campaign's primary domain appeared in search results during the report month
  • Impressions (Change): the percentage of change between the selected option from the "Compare to Past": (Baseline, Previous Period, Same Time Last Year or Custom Date) and the Current Impressions
  • Clicks (Baseline): the number of times a user clicked the campaign's primary domain's listing in search results for a particular query for the calendar month based on campaign creation date
  • Clicks (Current): the number of times a user clicked the campaign's primary domain's listing in search results for a particular query during the report month
  • Clicks (Change): the percentage of change between the selected option from the "Compare to Past": (Baseline, Previous Period, Same Time Last Year or Custom Date) and the Current Clicks
  • CTR (Current): the current click-through rate
Portfolio Report Campaign Selection

Campaigns

  • Both Industry and Profile menus allow quick selection from a predefined list. To add or edit these items open the campaign's General Settings  > Advanced Settings screen and add/edit industry or profile settings
  • Select the Campaigns from the list to include in the report
Portfolio Report Campaign Selection

Users

For this report, Users are the campaign managers that are assigned in the Campaign General Settings > Advanced Settings screen.
  • Select the Users from the list to be included in the report


Apply Changes

  • Whenever you make changes to Report Options you must click the Apply Changes button in the left sidebar in order for those changes to be saved.

Add to PDF Report


Conveniently add a report or graph with its current settings to a PDF report by hovering over the gold gear icon and selecting Add to PDF Reports

add report to PDF


Select the PDF Report that you want the report or graph added to
             
select white label report

Drag the new report or graph into the position you want it to display in the PDF and confirm that the Date settings do not conflict with the automated scheduling settings.

Add to Marketing Dashboard


Conveniently add a report or graph with its current settings to a marketing dashboard:

1. Hover over the gold gear icon and select Add to Marketing Dashboard
2. Select the Dashboard (campaign name)
3. Select the Dashboard Page that you want the report added to


add report to PDF


4. Click the "Go to Dashboard" link to further customize the report (e.g., drag it to a specific position on the page, change date settings, etc.)


Refer to the Report Options section for details regarding the display settings, filters and sort options available for this report.

The report date (or date range) is governed by the selected Dashboard date option: Date Selection or Fixed Periods, learn more...

  • Daily reports default to the last day of the selected period
  • Weekly and monthly reports default to 1 month of data
To change the number of weeks or months displayed in a specific report, click the gear icon for any marketing dashboard report element and expand the Date option section, enter the number and click the Save Button.
 
marketing dashboard report date options


Enterprise Account Features


Designed for marketing professionals who manage major brands or large numbers of clients, Rank Ranger Enterprise provides scalable access for teams, ensuring that everyone has the tools they need to be successful.

In addition to our standard plan features, Enterprise plans include:


Get the ultimate SEO tools with the Rank Ranger Software
Learn More About Rank Ranger