Search our Knowledge Base
Search

Google Analytics User Retention Widget


The User Retention Widget provides a high level view of user acquisition and retention. Options include date range, cohort size (based on number of days, weeks or months), and conversion, segment, and event filters. 

This widget can be used to research user engagement and disengagement to help identify common points of attrition, and define when re-marketing, email campaigns, or ads might be helpful to improve attrition rates. It can also help determine the rate at which new users need to be acquired to remedy attrition.

This widget can be added to white label Marketing Dashboards, Client Dashboards and PDF Reports. In marketing dashboards you can set it to display at half or full page width. You can view a marketing dashboard sample that contains this and additional widgets (password is demo).

Important! To view this report, Google Analytics must be configured correctly (please refer to our Google Analytics documentation).


Reports > Site Traffic > Widgets


Daily User Retention


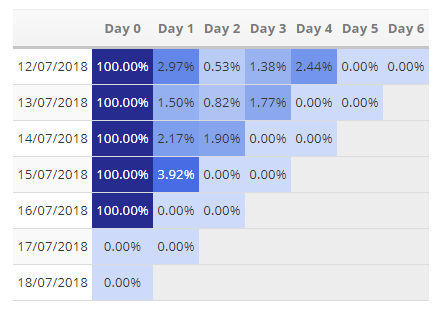
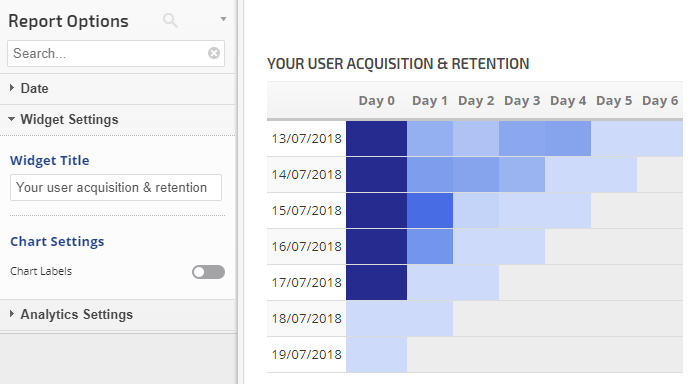
Cohort Analysis by Day
             
The first column displays the cohort size, the rest of the columns reflect time increments based on the size selected in report options.

The cell colors are indicators of relative metric values: the darkest representing the highest values, and the lightest representing the lowest values.   

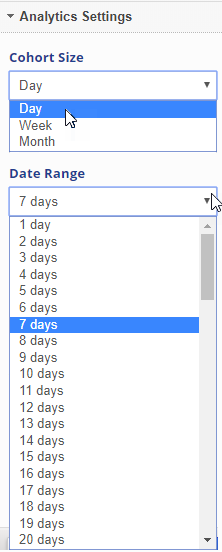
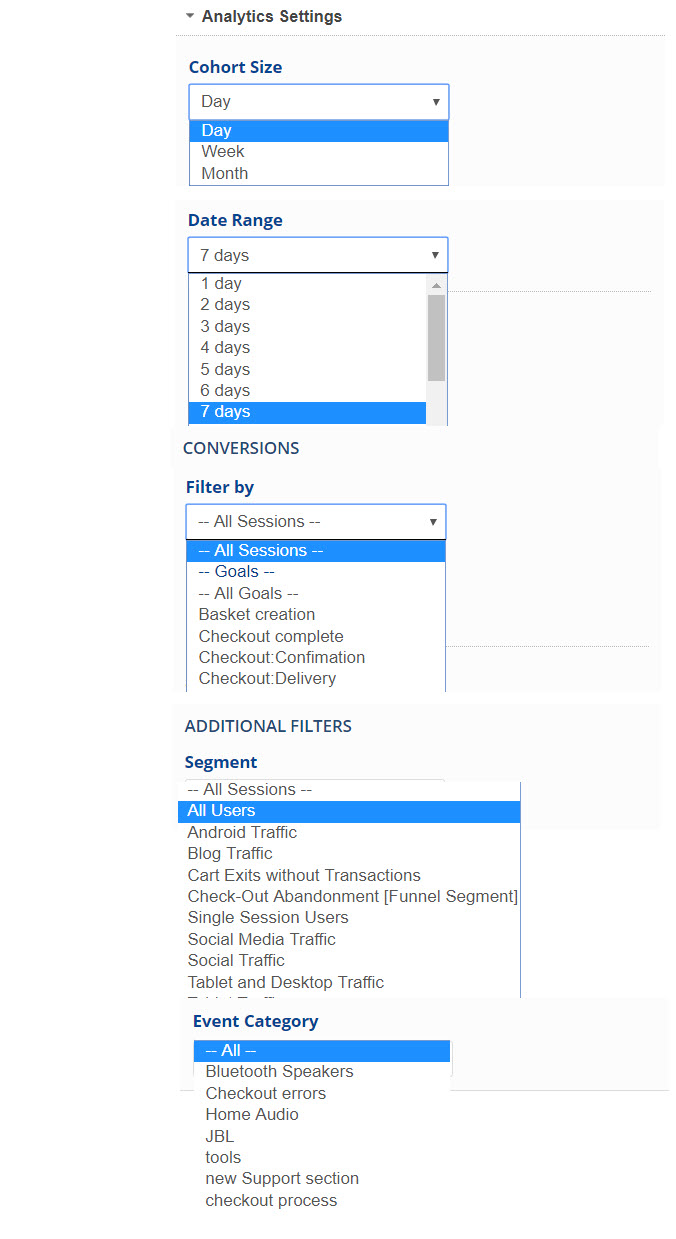
To create the above view, set the Cohort Size to Day, and select the number of days you want displayed. 


Weekly User Retention


Cohort Analysis by Week


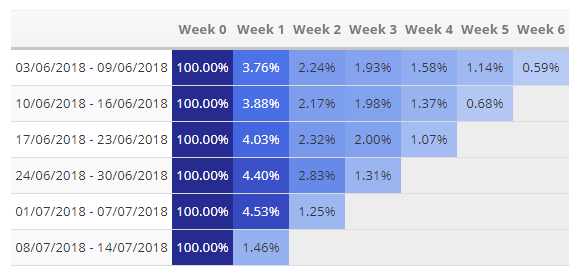
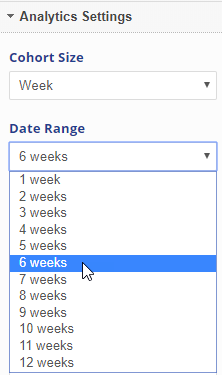
To create the above view, set the Cohort Size to Week, and select the number of weeks you want displayed.


Monthly User Retention


Cohort Analysis by Month


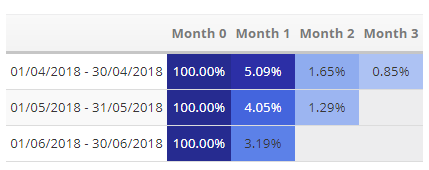
To create the above view, set the Cohort Size to Month, and select the number of months you want displayed.


Widget Title & Chart Labels


Widget Settings
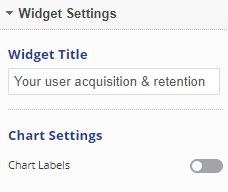
You can add a custom widget title to display above the widget, and display or hide the chart labels in the Widget Settings section of Report Options.  


User Retention Widget with Title & Chart Labels Hidden
Hovering over any cell reveals the user retention percentage and number of weeks (days or months, depending upon the selected cohort) after acquisition date.             
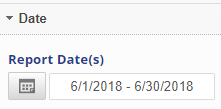


Report Options


Date


  • Select a date range
Widget Settings
  • Enter a Widget Title to be displayed above the widget (optional)
  • Chart Labels: display or hide the chart labels

Analytics Settings: Day Cohort Size


  • Cohort Size: select Day
  • Date Range: select the number of days you want displayed in the widget
Analytics Settings: Week Cohort Size
  • Cohort Size: select Week
  • Date Range: select the number of weeks you want displayed in the widget

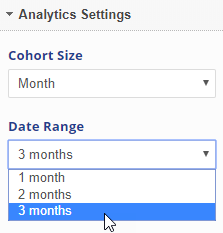
Analytics Settings: Month Cohort Size

 
  • Cohort Size: select Month
  • Date Range: select the number of months you want displayed in the widget

Filters

 
  • Conversions: display all sessions, all goals, or filter by a specific goal from the Google Analytics account for the site
  • Segment (optional): filter by a specific traffic type/source or user type
  •  Event Category (optional): filter by specific user interactions with site content (e.g., downloads, ad clicks, video plays, etc.)
    In order to use this feature, Google Tag Manager must be activated in the connected Google Analytics account. Learn more about their Event tracking feature.
Click the Apply Changes button.


Add to PDF Report


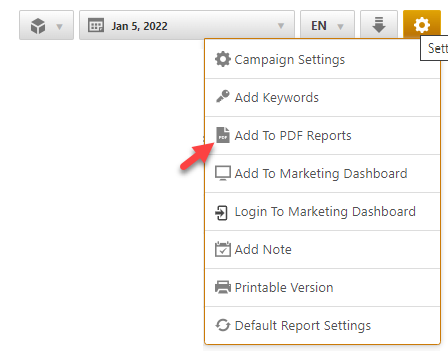
Conveniently add a report or graph with its current settings to a PDF report by hovering over the gold gear icon and selecting Add to PDF Reports

add report to PDF


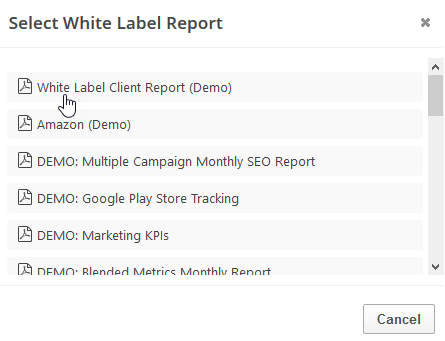
Select the PDF Report that you want the report or graph added to
             
select white label report

Drag the new report or graph into the position you want it to display in the PDF and confirm that the Date settings do not conflict with the automated scheduling settings.

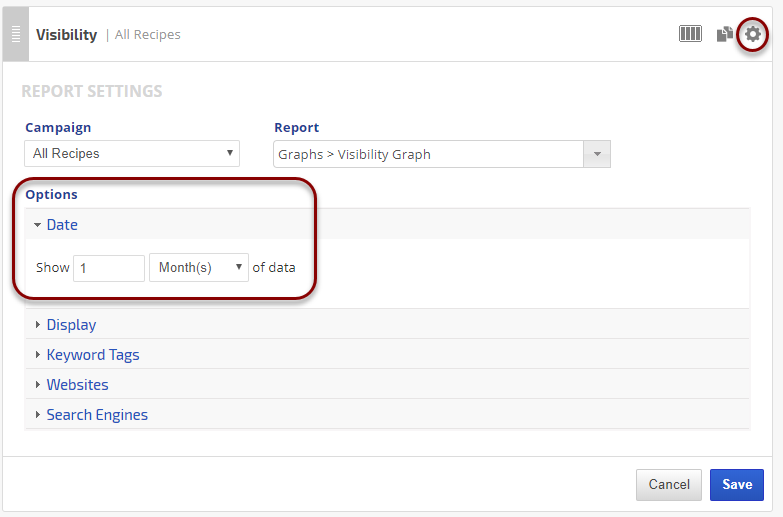
PDF Report Settings - User Retention

Reports and graphs can be added to automated PDF reports via the report screen (as described above) or manually in the PDF Report Content screen. If the report is added via the:
  • report screen, then begin by clicking the Edit button corresponding to the report
  • PDF Report Content screen, then click the Add Report button and select the Campaign name and Report: User Retention.
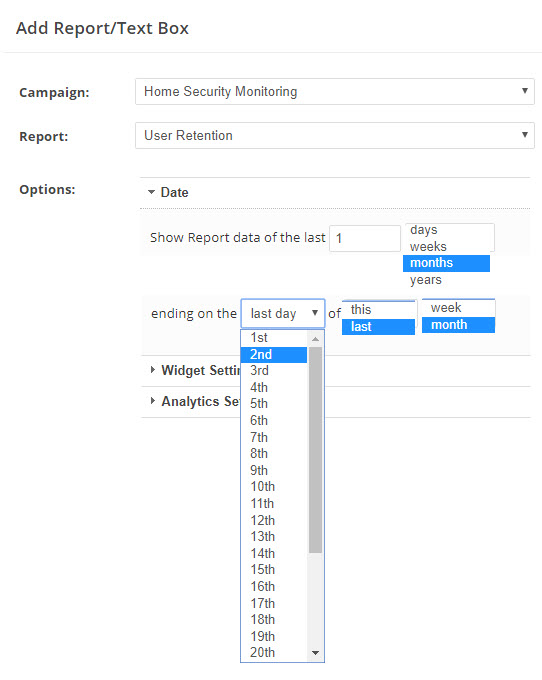
Date


Expand the Date Options section and in the Show Report date of the last field type in the number of periods to be displayed in the report.

In the next field select one of the following options:
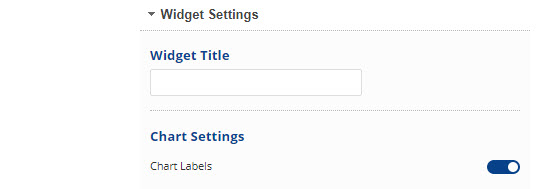
  • days
  • weeks
  • months
  • years
In the ending on the field select one of the following options:
  • first day
  • last day
  • or a specific day of the month
  • or a specific day of the week (when weekly reports are selected)
In the of field select one of the following options:
  • this
  • last
In the next field select one of the following options:
  • week
  • month
The Date selection must produce a logical date setting based on the PDF report's automated scheduling (at the bottom of the Report Details screen). For example:
  • last day of last month
  • 1st of this month
  • last day of last week
If the report is scheduled to be sent every Monday, then the following example would be invalid:
  • Saturday of this week (because weeks begin on Sunday and if reports are sent on Monday, then Saturday of this week hasn't yet occurred).
If the report is scheduled to be sent on the 1st day of every month, the following example would be invalid:
  • last day of this month (because it's only the 1st day of the month the report is being sent)

Widgets


Enter a Widget Title to describe your widget content (optional).

Display Chart Labels by moving the slider to the right.

Analytics Settings


  • Select a Cohort Size from the menu.
  • Select a Date Range from the menu.
  • Select Conversions filter: display all sessions, all goals, or filter by a specific goal from the Google Analytics account for the site.

  • Filter by Segments (optional): choose from the list of Google's built-in Segments, or self-defined Custom Segments that have been created in the Google Analytics account for the tracked site.

  • Event Category (optional): filter by specific user interactions with site content (e.g., downloads, ad clicks, video plays, etc.)
    In order to use this feature, Google Tag Manager must be activated in the connected Google Analytics account. Learn more about their Event tracking feature.


Add to Marketing Dashboard


Conveniently add a report or graph with its current settings to a marketing dashboard:

1. Hover over the gold gear icon and select Add to Marketing Dashboard
2. Select the Dashboard (campaign name)
3. Select the Dashboard Page that you want the report added to


add report to PDF


4. Click the "Go to Dashboard" link to further customize the report (e.g., drag it to a specific position on the page, change date settings, etc.)


Refer to the Report Options section for details regarding the display settings, filters and sort options available for this report.

The report date (or date range) is governed by the selected Dashboard date option: Date Selection or Fixed Periods, learn more...

  • Daily reports default to the last day of the selected period
  • Weekly and monthly reports default to 1 month of data
To change the number of weeks or months displayed in a specific report, click the gear icon for any marketing dashboard report element and expand the Date option section, enter the number and click the Save Button.
 
marketing dashboard report date options


Add to Client Dashboard


Customize Report for Client Dashboard

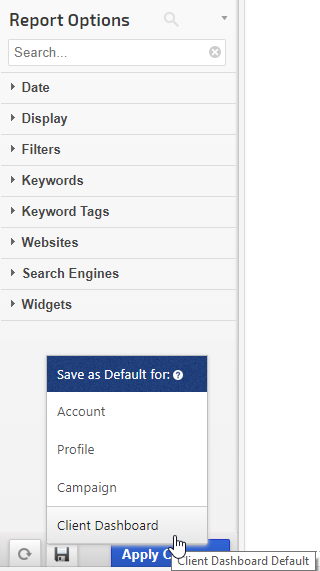
Client Dashboards display our default report options for each individual report and graph until you modify them. To customize the display of the report, expand the Report Options section, change the settings and click the Apply Changes button.

Then expand Report Options again and hover over the Save icon and select Save as Default for Client Dashboard.

report options

After saving the Client Dashboard default, any changes that you make to the report options will not affect the display in the Client Dashboard unless you overwrite it by following these instructions again.


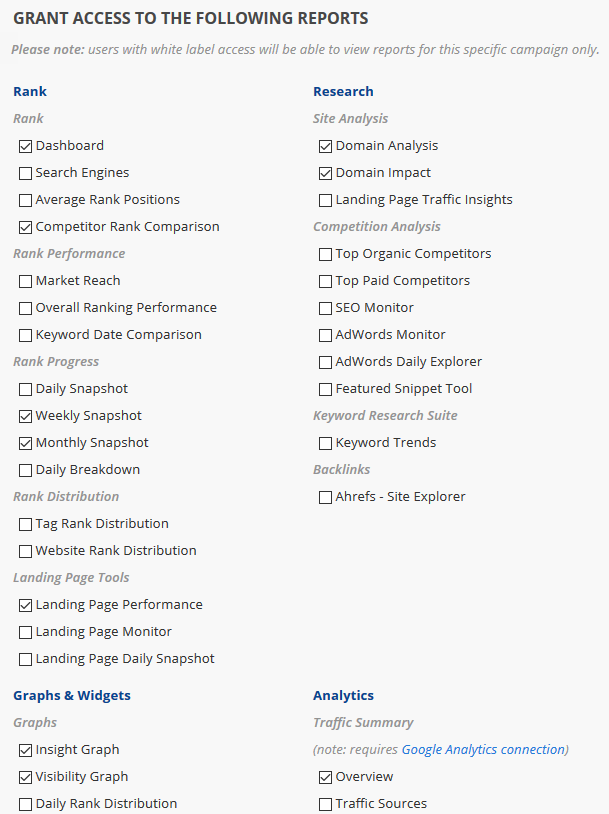
Enable the Report or Graph to display in the Client Dashboard

Open the Campaign Settings > Client Dashboard screen and check the box corresponding to the report(s) you want displayed in the dashboard, and then click the Save button. 

access permissions to client dashboard


Refer to Client Dashboard Settings documentation for additional instructions for customizing your dashboard.


Google Analytics Reports and Graphs

Google Search & Ad Metrics Glossary


The below-listed metrics are only for the Google Analytics Universal Profile connection.
Wondering what some of the Google metrics in our reports and graphs mean? 

Ad Clicks Displays the number of times viewers of a banner click on an ad to view the full offer.
All Users Total of new users and returning users for a given period of time.
Assisted Conversions Google's measure of any interaction, other than the final click, that led to a consumer converting on a website.
Assisted Value The total value of the conversions assisted by the channel.
Attribution The process of assigning credit for sales and conversions to touchpoints in conversion paths.
Attribution allows marketers to quantify each channel's contribution to sales and conversions. For example, many people may purchase on your site after searching for your brand on Google.
Refer to this Google Support document for more information.
Avg. Time on Site Displays the average length of time a visitor spent on a particular page or set of pages.
Avg. Value A calculation of Event Value / Total Events.
Bounce Rate Displays the percentage of single-page visits (i.e. visits in which the person left your site from the page they entered through without going deeper inside your site).
Completions The total number of users who have completed all elements defined for a particular goal.
Conversion A completed activity, online or offline, that is important to the success of your business. Examples include a completed sign-up for your email newsletter (a Goal conversion) and a purchase (a transaction, sometimes called an Ecommerce conversion).
Refer to this Google Support document for more information.
Conversion Rate The number of conversions is divided by the number of total ad clicks that can be tracked to a conversion during the same time period.
Cost The total cost of Google AdWords campaigns, in currency units defined by the Google account user.
Channel Grouping A roll-up of traffic sources in the Acquisition reports that groups several marketing activities together. Channel groupings allow you to view and compare aggregated metrics by channel name, as well as an individual traffic source, medium, or campaign name.
Refer to this Google Support document for more information.
CPC (Cost Per Click) Cost-per-click is the average cost an advertiser paid for each click on search ad(s).
CTR (Click Through Ratio) Displays the Click-through-ratio for an ad.  This is equal to the number of clicks divided by the number of impressions the ad received.
Dimension A descriptive attribute or characteristic of an object that can be given different values.
For example, a geographic location could have dimensions called Latitude, Longitude, or City Name. Values for the City Name dimension could be New York, London, etc.
Refer to this Google Support document for more information.
Event A type of hit used to track user interactions with content. Examples of user interactions commonly tracked with Events include downloads, mobile ad clicks, gadgets, Flash elements, AJAX embedded elements, and video plays.
Refer to this Google Support document for more information.
Event Value A calculation of Total Event * Value.
Exit Rate How often do users end their session or leave the site after viewing a particular page
Goal A configuration setting that allows you to track the valuable actions, or conversions, that happens on a site or mobile app.
Goals allow you to measure how well your site or app fulfills your target objectives.
Refer to this Google Support document for more information.
Hits An interaction that results in data being sent to Analytics. Common hit types include page tracking hits, event tracking hits, and e-commerce hits.
Each time the tracking code is triggered by a user’s behavior (for example, the user loads a page on a website or a screen in a mobile app), Analytics records that activity. Each interaction is packaged into a hit and sent to Google’s servers.
Refer to this Google Support document for more information.
Impressions (Ads) The measurement of how many times an ad is shown.
Impressions (Search Console) An impression is the display of a website link in search results or an advertisement. This metric accounts for the total number of impressions recorded by Google for a website or ad campaign.
Last Interaction Conversions The ratio of assisted/last interaction conversions. This is a number that indicates whether this channel primarily results in last interaction conversions or is predominantly assisted conversions. Numbers of 1.5 and higher indicate that this channel is predominantly accounting for assisted conversions, while numbers closer to 0 indicate the channel’s contribution to conversions is predominantly as the last interaction.
Last Interaction Value The total value of the conversions completed by the listed channels.
Metric Individual elements of a dimension that can be measured as a sum or a ratio.
For example, the dimension City can be associated with a metric like Population, which would have a sum value of all the residents of the specific city.
Refer to this Google Support document for more information.
New Users New Users is based on Google's ga:newUsers metric and represents the number of sessions marked as a user's first sessions.
New Users % New Users % is based on Google's ga:percentNewSessions metric that represents the percentage of sessions by users who had never visited the site before. It does not represent the number of new users between one period and the previous. In this Google Developer document, it is described as the calculation of ga:newSessions / ga:sessions
New Visits Displays the number of new visits by people who have never been to the site before.
Organic Traffic Number of users who find your website ‘organically’ through search results, as opposed to via a paid ad, clicking a link on another site, or from a bookmark they already have saved.
Paid Traffic Number of visitors to your site who came there via Google Ads, paid search keywords and other online ad campaigns.
Pageviews An instance of a page being loaded (or reloaded) in a browser.
Pageviews is a metric defined as the total number of pages viewed.
Refer to this Google Support document for more information.
Permission The right to perform administrative and configuration tasks, to create and share assets, and to read and interact with report data.
Refer to this Google Support document for more information.
Property A sub-component of an Analytics account that determines which data is organized and stored together.
Refer to this Google Support document for more information.
Revenue Specifies the total revenue or grand total associated with the transaction (e.g. 11.99). This value may include shipping, tax costs, or other adjustments to total revenue that you want to include as part of your revenue calculations.
Roll-Up Reporting A feature of Roll-Up Properties, which aggregate data from multiple source properties into a single property.
Refer to this Google Support document for more information.
Sampling The practice of selecting a subset of data from your traffic and reporting on the trends detected in that sample set.
Refer to this Google Support document for more information.
Segment A subset of sessions or users that share common attributes.
Segments allow you to isolate and analyze groups of sessions or users for better analysis.
Refer to this Google Support document for more information.
Session The period of time a user is active on your site or app.
By default, if a user is inactive for 30 minutes or more, any future activity is attributed to a new session.
Refer to this Google Support document for more information.
Sessions with Event The number of sessions during which an Event was recorded.
Source / Medium Source: the origin of your traffic, such as a search engine (for example, google) or a domain (example.com).
Medium: the general category of the source, for example, organic search (organic), cost-per-click paid search (cpc), web referral (referral).
Refer to this Google Support document for more information.
Tags Referring to Google Tag Manager, a Tag is a snippet of JavaScript that sends information to a third party, such as Google. The Analytics tracking code is an example of a tag.
Refer to this Google Support document for more information.
Total Events A total of Events (executions of a specific action) that occurred on a website during a specified period of time.
Unique Events The number of unique events that occurred on a website during a specific period of time.
Unique Page Views The number of times a page was viewed during a specific time period.
Views The number to views a website or specific web page received during a report period.
Visits By Medium Displays the number of visits by medium through which your site was reached. For example, every referral to a website also has a medium. Possible mediums include: "organic” (unpaid search), "cpc” (cost per click, i.e. paid search), "referral” (referral), "email” (the name of a custom medium you have created), "none” (direct traffic has a medium of "none”).
Visits By Source Displays the number of visits by source that brought visitors to your website. For example, every referral to a web site has an origin, or source. Possible sources include: "google” (the name of a search engine), "facebook.com” (the name of a referring site), "spring_newsletter” (the name of one of your newsletters), and "direct” (users that typed your URL directly into their browser, or who had bookmarked your site).

We will update this periodically, but in the meantime if there are metrics you're curious about that aren't listed in this glossary, please refer to this Google support document.


Get the ultimate SEO tools with the Rank Ranger Software
Learn More About Rank Ranger