The Analytics Audience Demographics report can be customized to include Age & Gender charts & tables, plus Sessions Summary. A Compare to Past feature allows you to view comparison data for the previous period, same time last year, or a custom date range.
Report data can be filtered by Key Metric (sessions, percentage of new sessions, new users, bounce rate or pages per session), Segment, and Goal Conversion type. Goal Value can be displayed in your choice of world currencies.
Please note that the data in this report is based on Sessions for which users have identified themselves as Male or Female. Since it is possible for users to opt-out of gender and other identifiers, the totals in the Session Summary might not match those displayed in our Analytics Traffic Overview report.
Important! To view this report Google Analytics must be configured correctly (please refer to our Google Analytics documentation) and using Google's Universal Analytics for the primary domain.
- SEO
- Rank Tracker
- Local SEO
- Mobile SEO
- Link Manager
- Landing Pages
- Social Signals
- On-Page Optimization
- Enterprise SEO Solutions
- Marketing
- Competition Analysis
- Insight Graph
- Keyword Research
- Graphs & Widgets
- Market Reach
- Marketing KPI
- Brand Visibility
- White Label SEO
- Marketing Dashboard
- Client Dashboard
- PDF Reports
- PDF Templates
- Other
- Email Notifications
- Portfolio Management
- Integrations
- Google Analytics
- Search Console
- Pay Per Click
- WeDevelop
- API
Audience Demographics
Analytics Audience Demographics
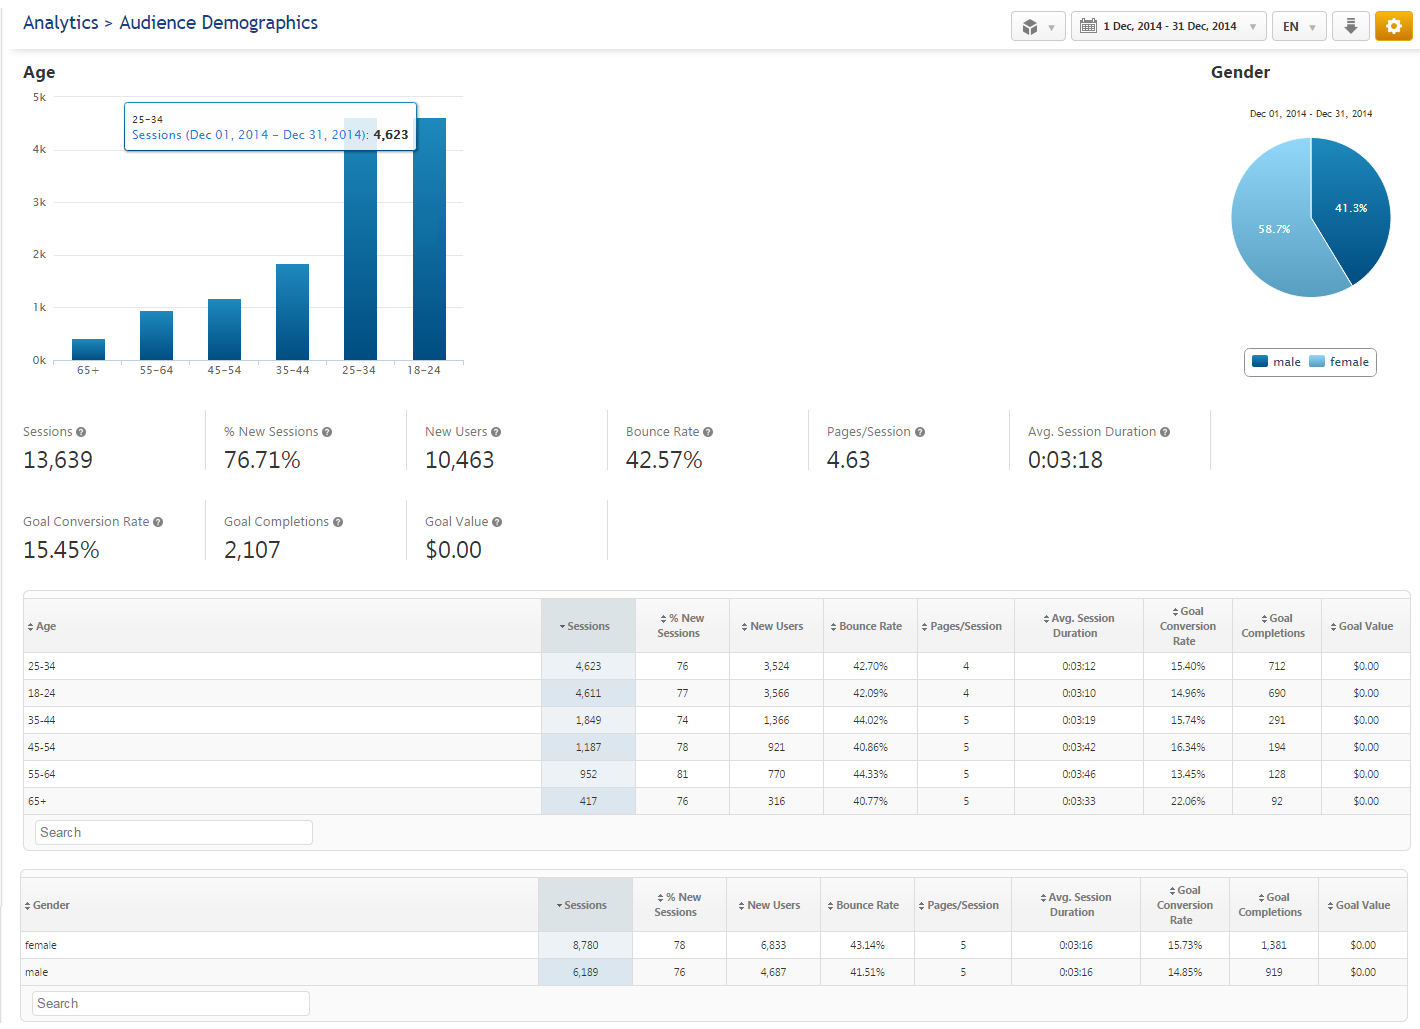
In this view, Sessions and Goal Completion data is displayed by Age and Gender.
In this view, Sessions and Goal Completion data is displayed by Age and Gender.
Compare Analytics Audience Demographics to Previous Period
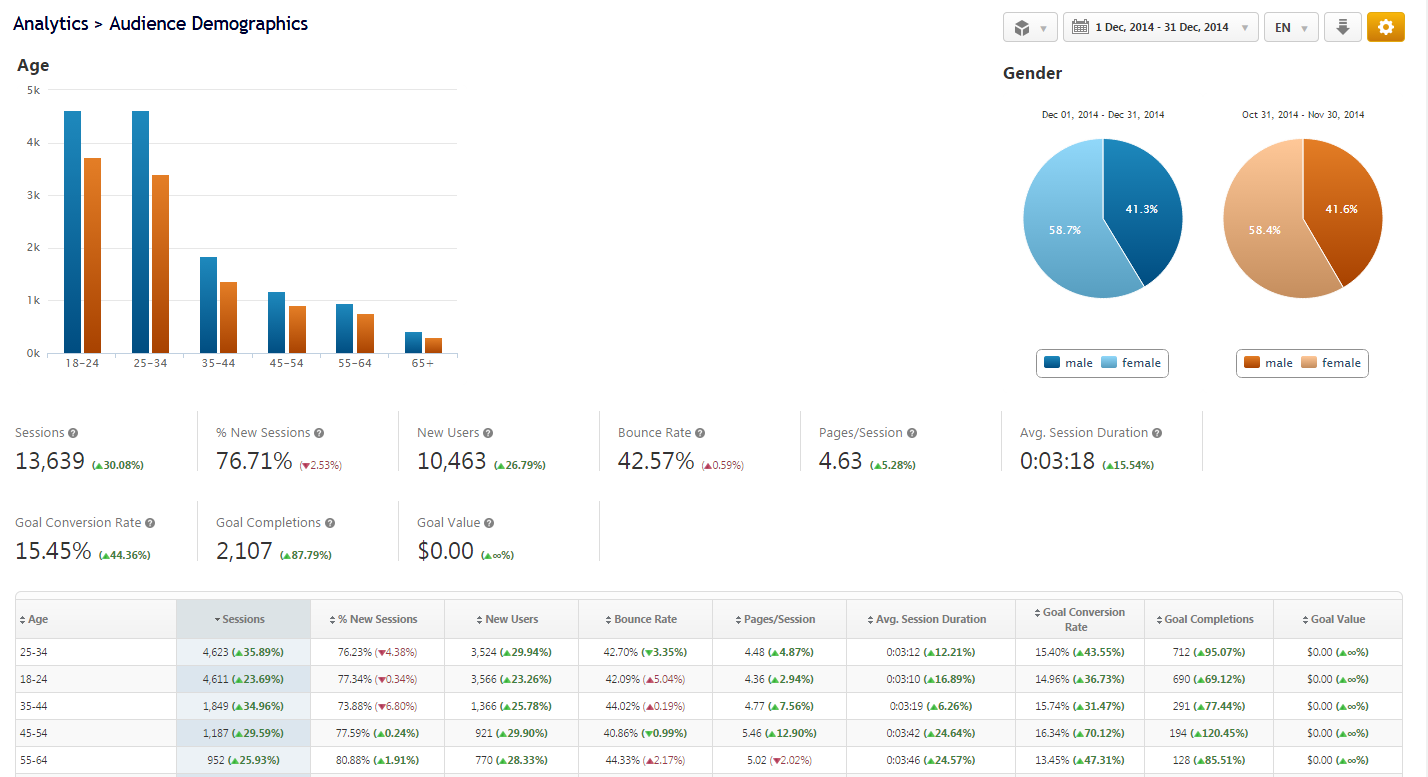
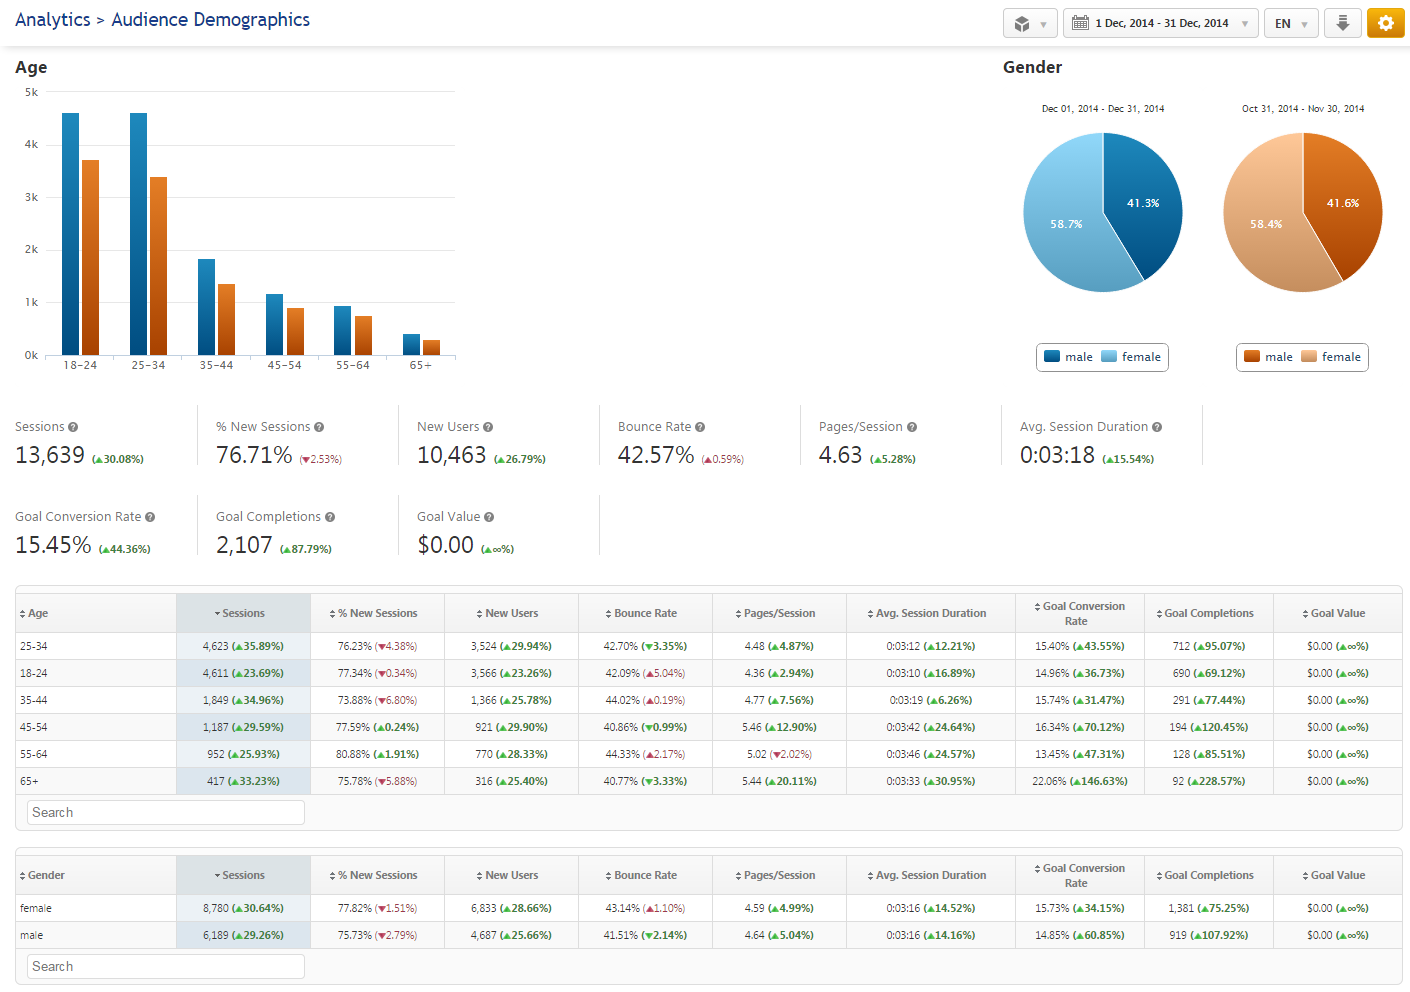
In this view, the audience data is displayed with both current and previous period Session and Goal Conversion data by Age and Gender.
In this view, the audience data is displayed with both current and previous period Session and Goal Conversion data by Age and Gender.
Audience Age Demographics
Age Chart: hover over a bar on the chart to view specific Age Key Metric results. Based on your selection in Report Options, this could be sessions, % of new sessions, new users, bounce rate, pages per session, or a variety of goal options. This comparative view is achieved by checking the Compare to Past option in the Date settings.
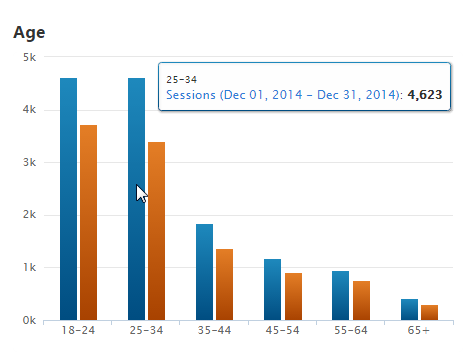
Age Chart: hover over a bar on the chart to view specific Age Key Metric results. Based on your selection in Report Options, this could be sessions, % of new sessions, new users, bounce rate, pages per session, or a variety of goal options. This comparative view is achieved by checking the Compare to Past option in the Date settings.
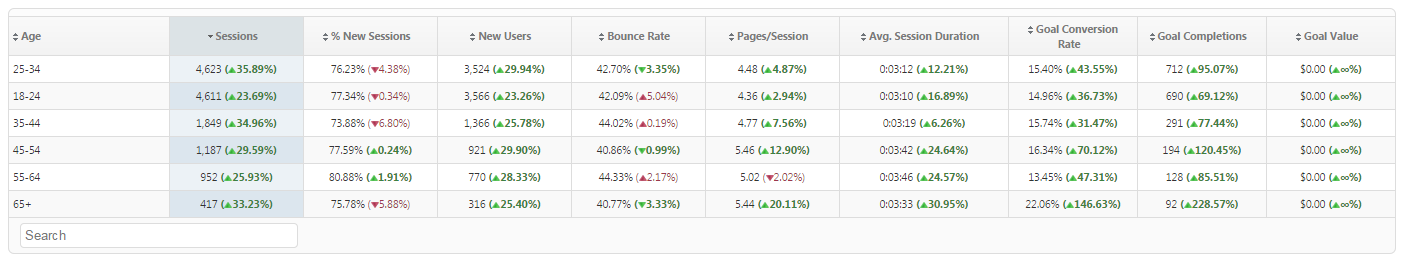
Age Table provides a breakdown of key metrics by age. The percent of change is based on the option selected in the Date settings.
Audience Gender Demographics
Gender Chart: hover over a section to view the Gender Key Metric (e.g., sessions, % of new sessions, new users, bounce rate, pages per session, or a variety of goal options) based on your selection in the Analytics options. This comparative view is achieved by settings in the Date section of Report Options.
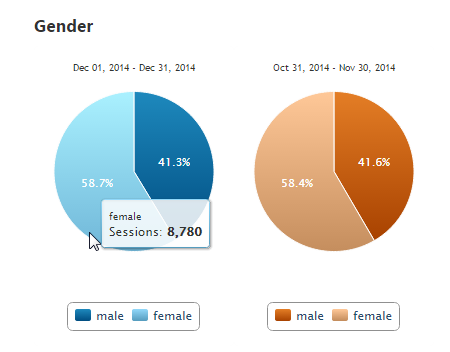
Gender Chart: hover over a section to view the Gender Key Metric (e.g., sessions, % of new sessions, new users, bounce rate, pages per session, or a variety of goal options) based on your selection in the Analytics options. This comparative view is achieved by settings in the Date section of Report Options.
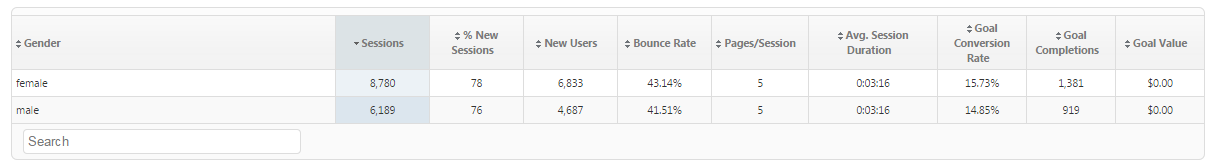
Gender Table provides a breakdown of key metrics by gender and can be set to compare to a previous period in the Date settings of Report Options.
Analytics Session Summary
The Session Summary provides data based on the filters you select in Report Options and can also be set to Hide if you don't want it displayed in a particular version of the report.
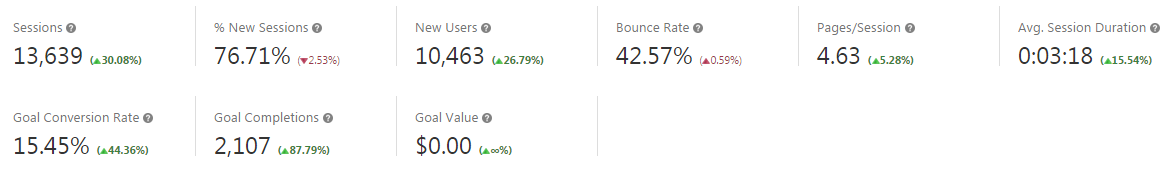
The Session Summary provides data based on the filters you select in Report Options and can also be set to Hide if you don't want it displayed in a particular version of the report.
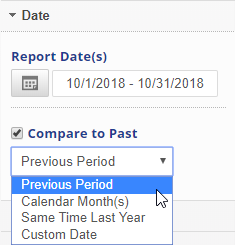 |
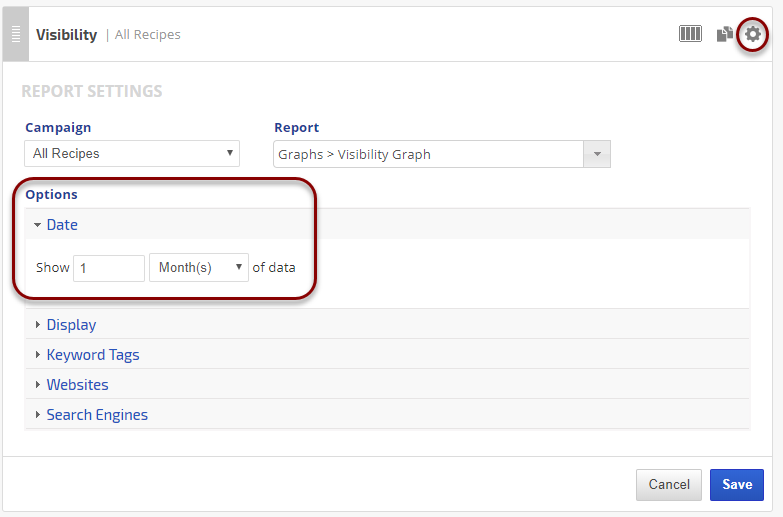
Dates
|
 |
General Settings
|
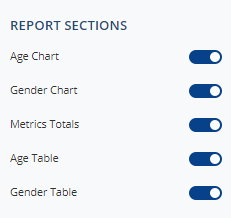 |
Report Sections: display or hide:
|
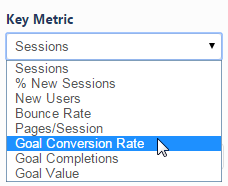 |
Select the Google Analytics Key MetricDetermines the results displayed in the Age and Gender charts.
|
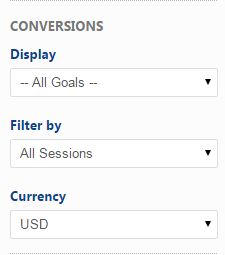 |
Goals and ConversionsInclude or exclude goal data:
|
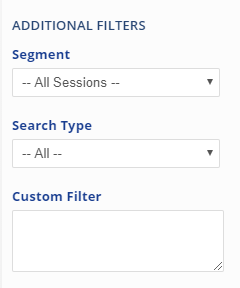 |
Additional Filters
|
Google Analytics API limits the number of requests from an IP address for a domain each day. If you see a screen in our Analytics section that displays titles but no data, it could be that you/your team have exceeded that threshold by multiple rechecks. Logging in from a different IP address or waiting until the next day should resolve the issue. Please contact us if the issue is not resolved within 24 hours.
Add to PDF Report
Conveniently add a report or graph with its current settings to a PDF report by hovering over the gold gear icon and selecting Add to PDF Reports
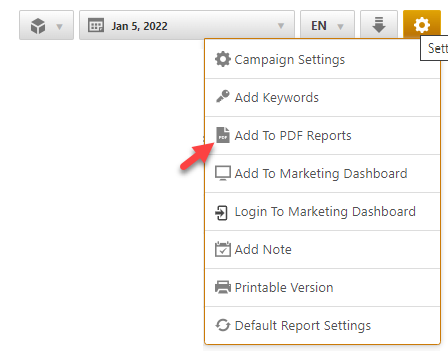
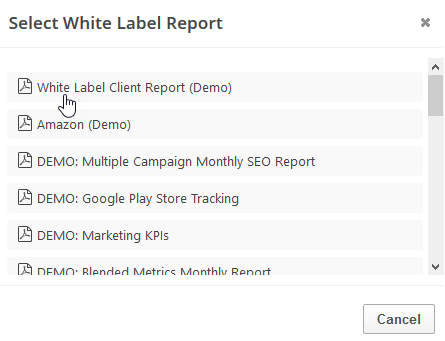
Select the PDF Report that you want the report or graph added to
Drag the new report or graph into the position you want it to display in the PDF and confirm that the Date settings do not conflict with the automated scheduling settings.
Add to Marketing Dashboard
Conveniently add a report or graph with its current settings to a marketing dashboard:
1. Hover over the gold gear icon and select Add to Marketing Dashboard
2. Select the Dashboard (campaign name)
3. Select the Dashboard Page that you want the report added to

1. Hover over the gold gear icon and select Add to Marketing Dashboard
2. Select the Dashboard (campaign name)
3. Select the Dashboard Page that you want the report added to
4. Click the "Go to Dashboard" link to further customize the report (e.g., drag it to a specific position on the page, change date settings, etc.)

Refer to the Report Options section for details regarding the display settings, filters and sort options available for this report.
The report date (or date range) is governed by the selected Dashboard date option: Date Selection or Fixed Periods, learn more...
- Daily reports default to the last day of the selected period
- Weekly and monthly reports default to 1 month of data