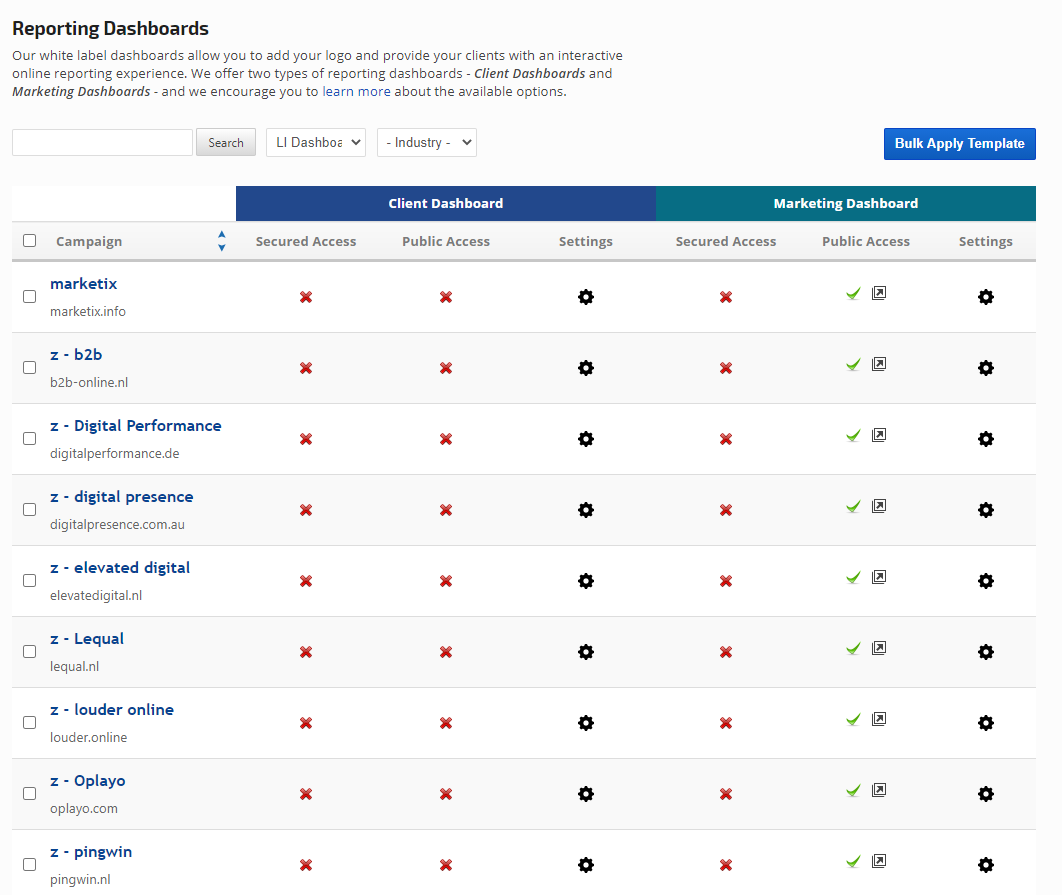
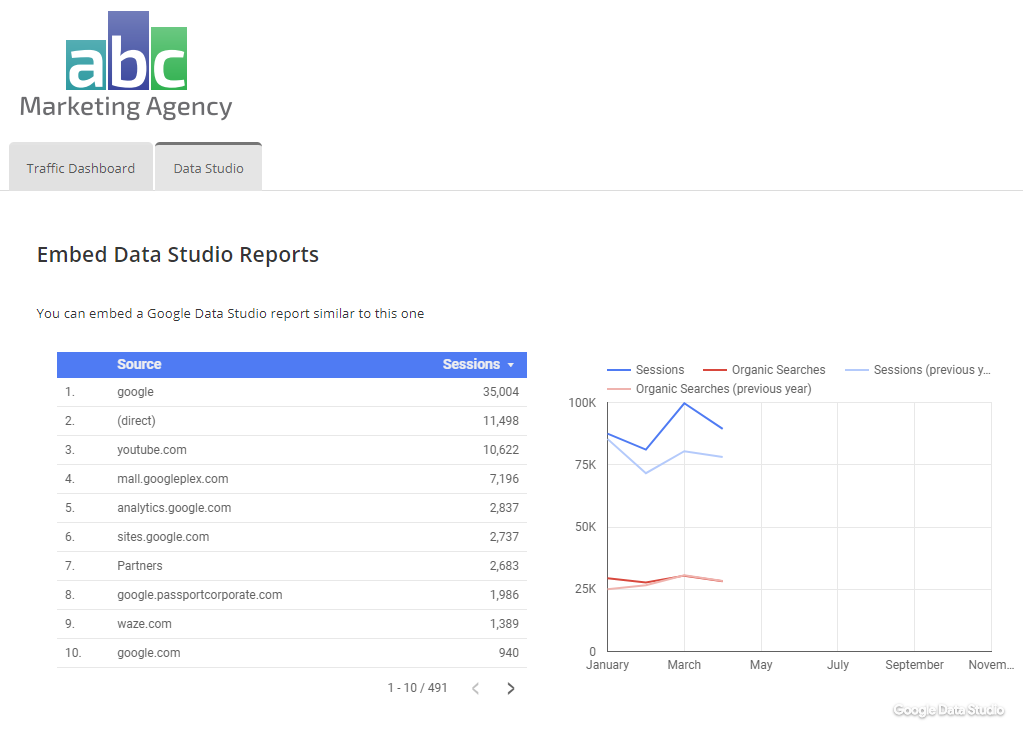
All reporting platform plans are equipped with our original
Client Dashboards. This online dashboard mirrors the Rank Ranger Platform layout to the extent of the reports you choose to include, and permissions you establish for each client.
The
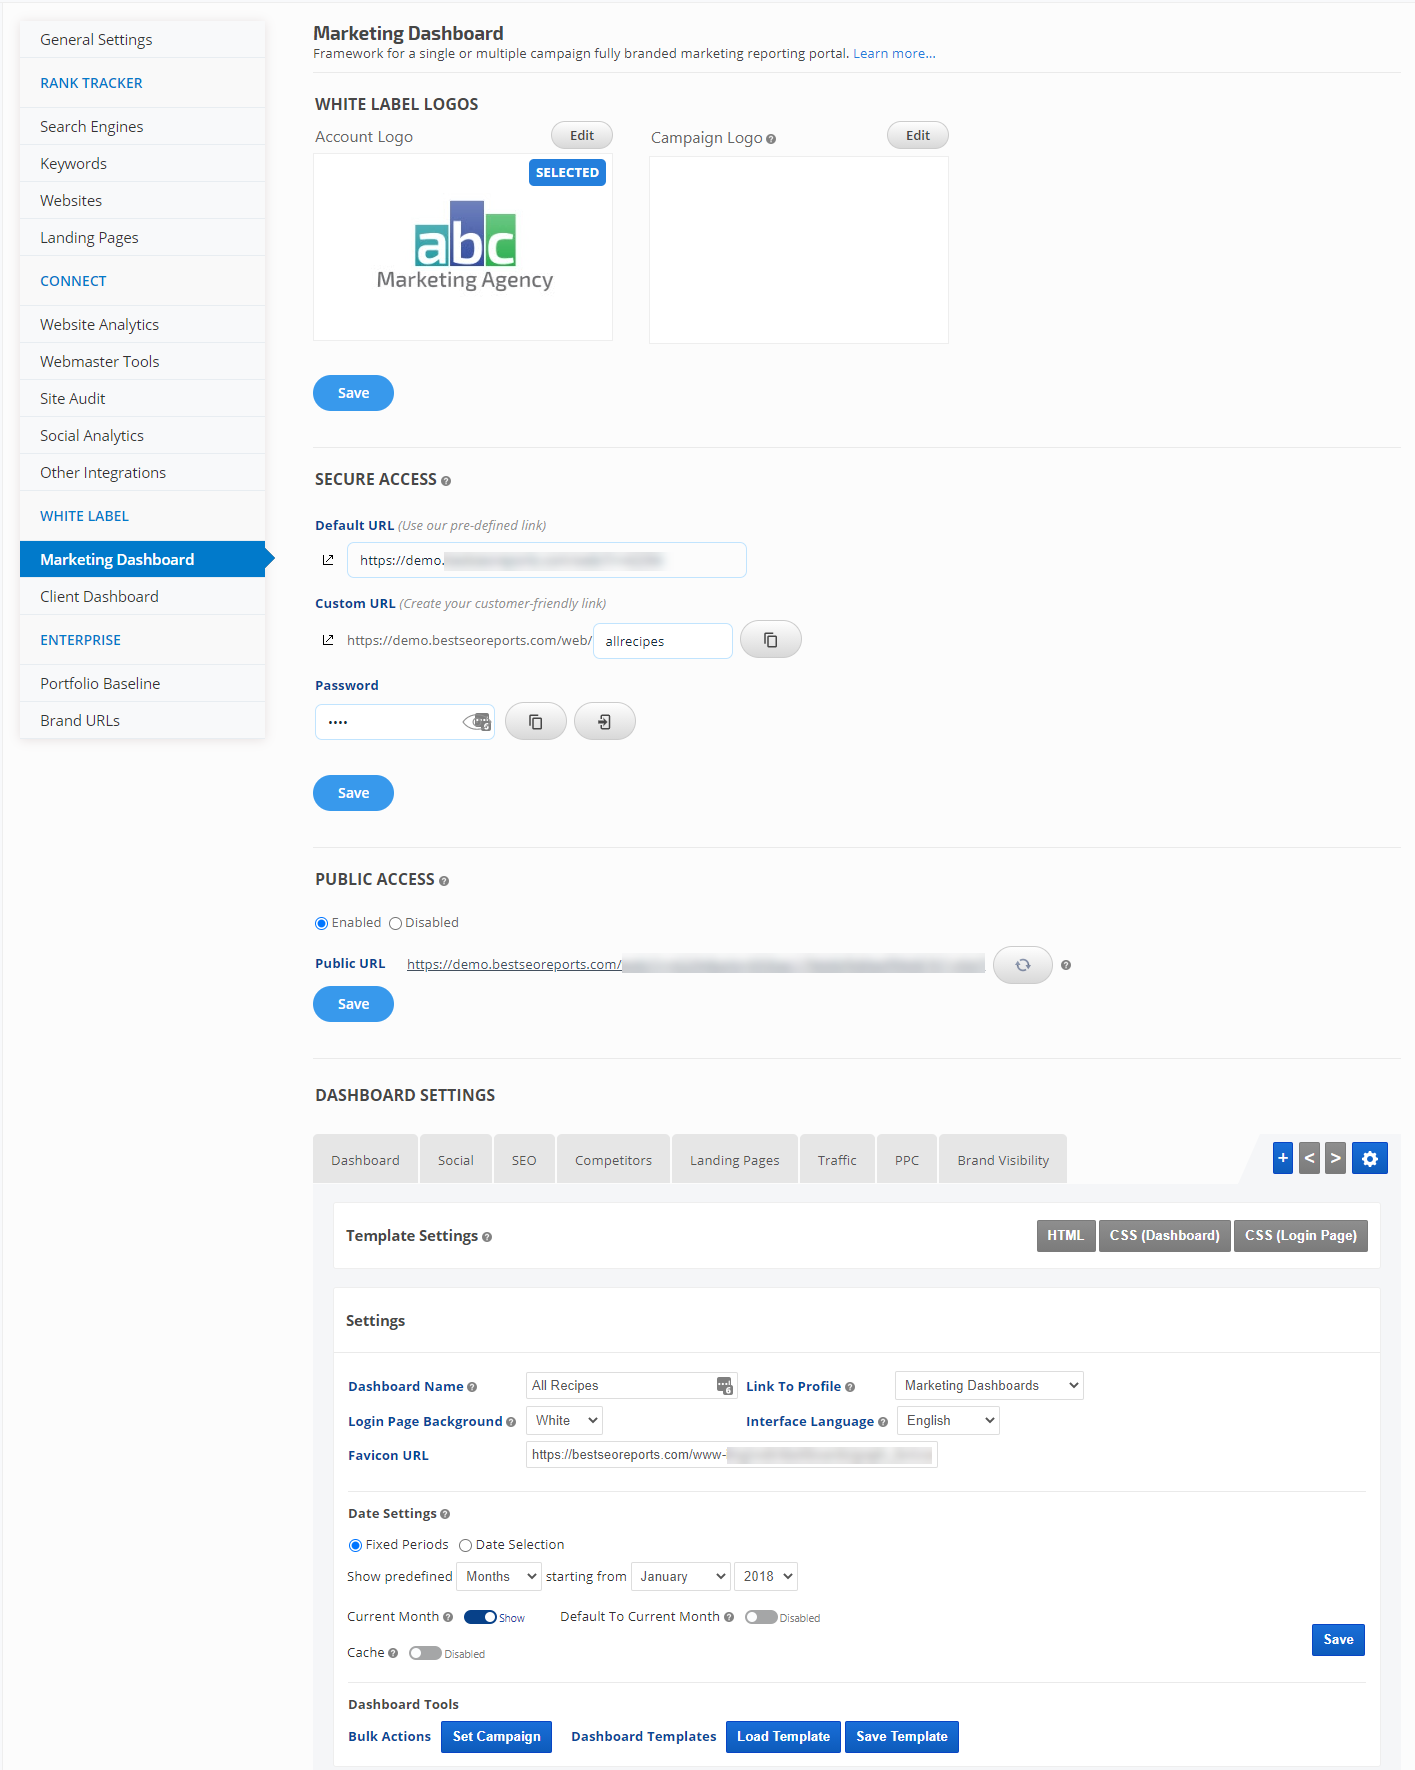
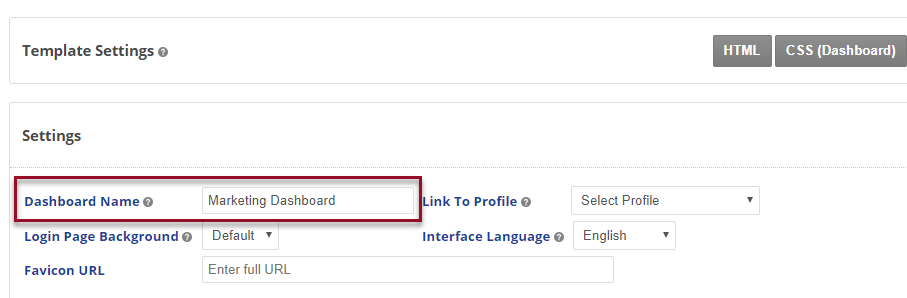
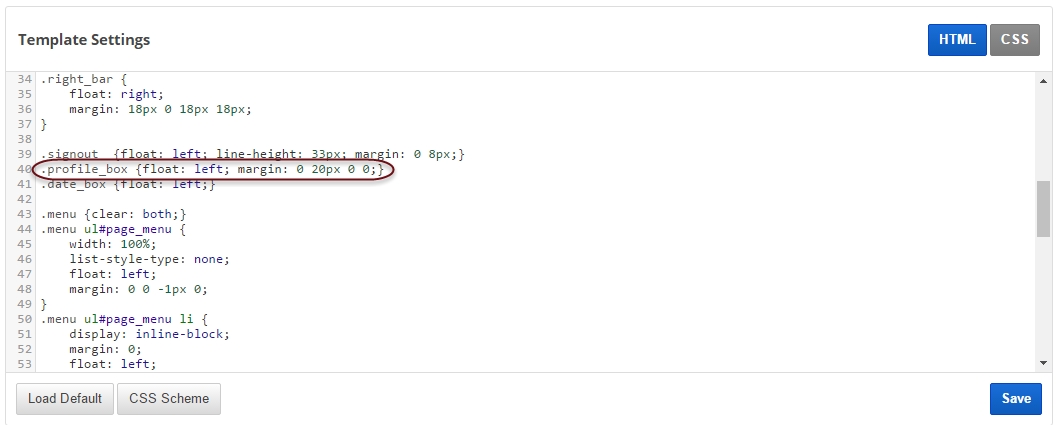
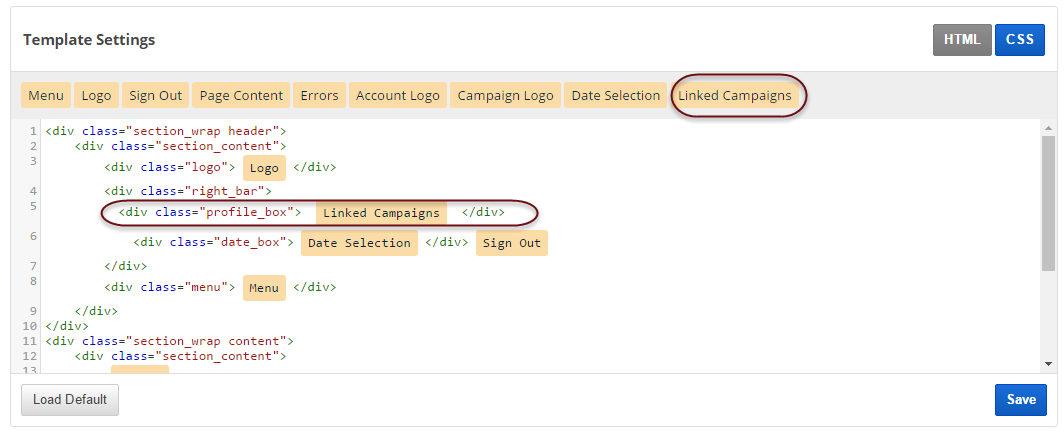
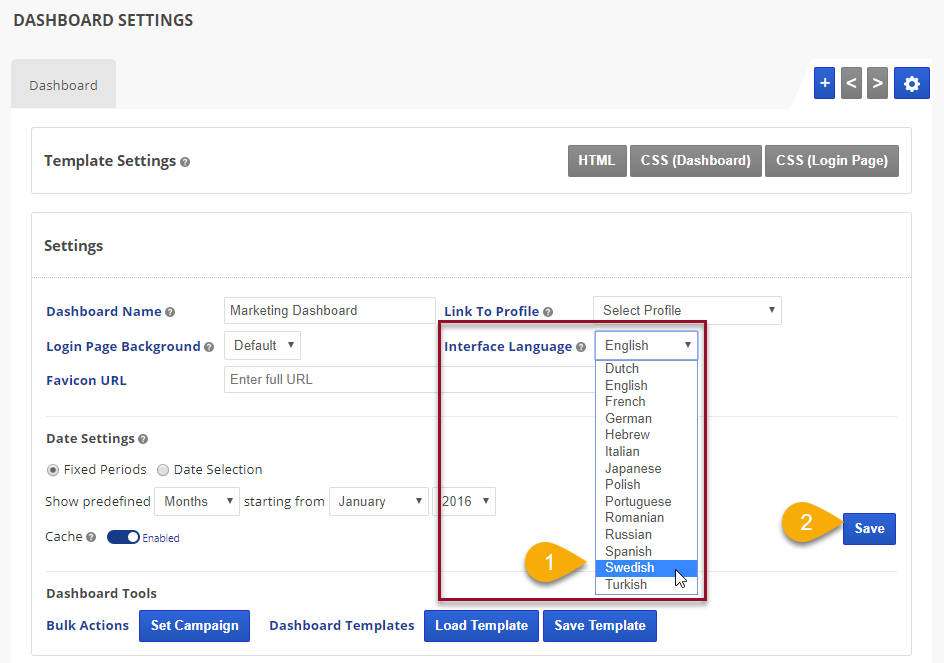
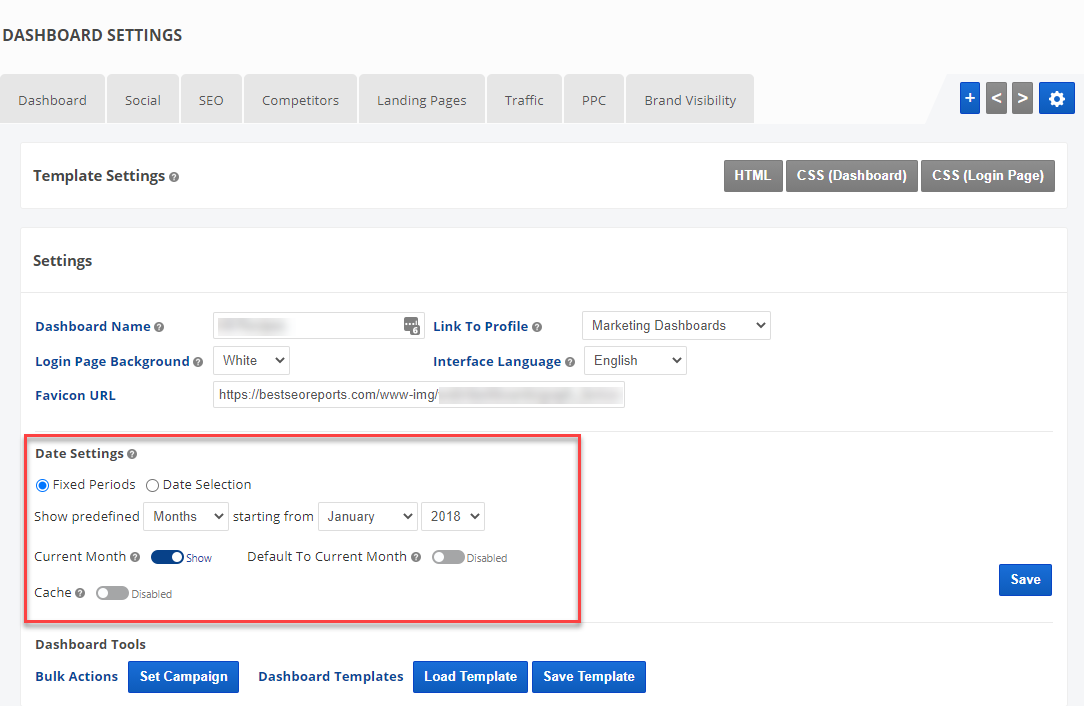
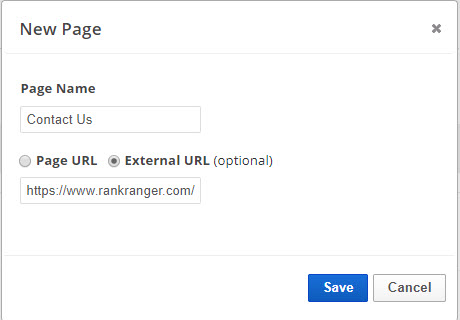
Marketing Dashboard, originally a premium feature is now also included in reporting platform plans. It provides a website style framework that is customizable with access to HTML and CSS. Additional features include a built-in dashboard navigation menu for web pages and external links, page elements that can be sized to 1/2 or full screen width for the report, graph, and text box layout flexibility, a WYSIWYG text editor for static or scheduled messages, and embedding of files and images, templates, and support for multiple versions of the same reports and graphs.
| Feature |
Client Dashboard
|
Marketing Dashboard
|
| Design |
Mirrors the Rank Ranger platform based on the reports and permissions enabled for client view
|
Website style framework with fully customizable HTML and CSS. Page elements can be sized to 1/2 or
full screen width for layout flexibility
|
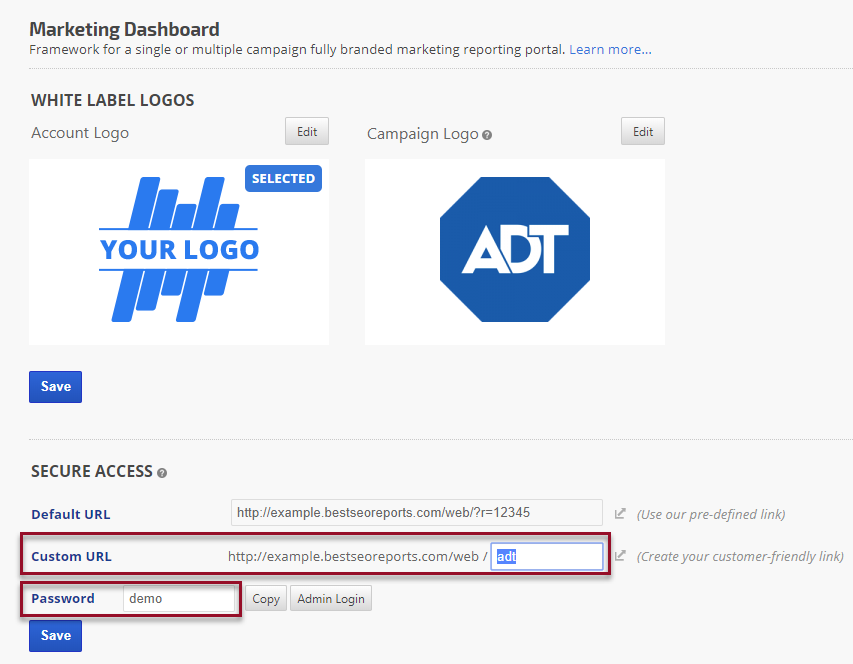
White Label Logo
|
1: choice of your company logo or your client's logo
|
2: choice of one or both your company logo and client's logo
|
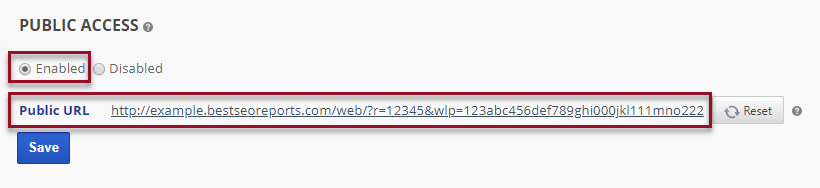
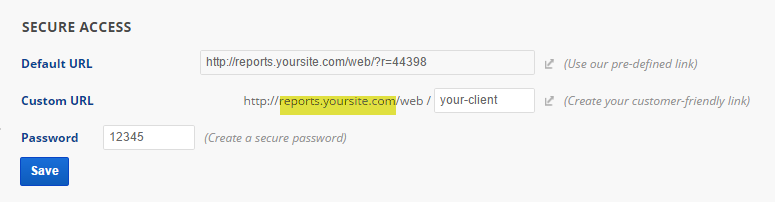
Client Access URL
|
Login credentials or public URL
|
Login credentials or public URL
|
Use your domain URL
|
Custom Domain, add-on option
|
Custom Domain, add-on option
|
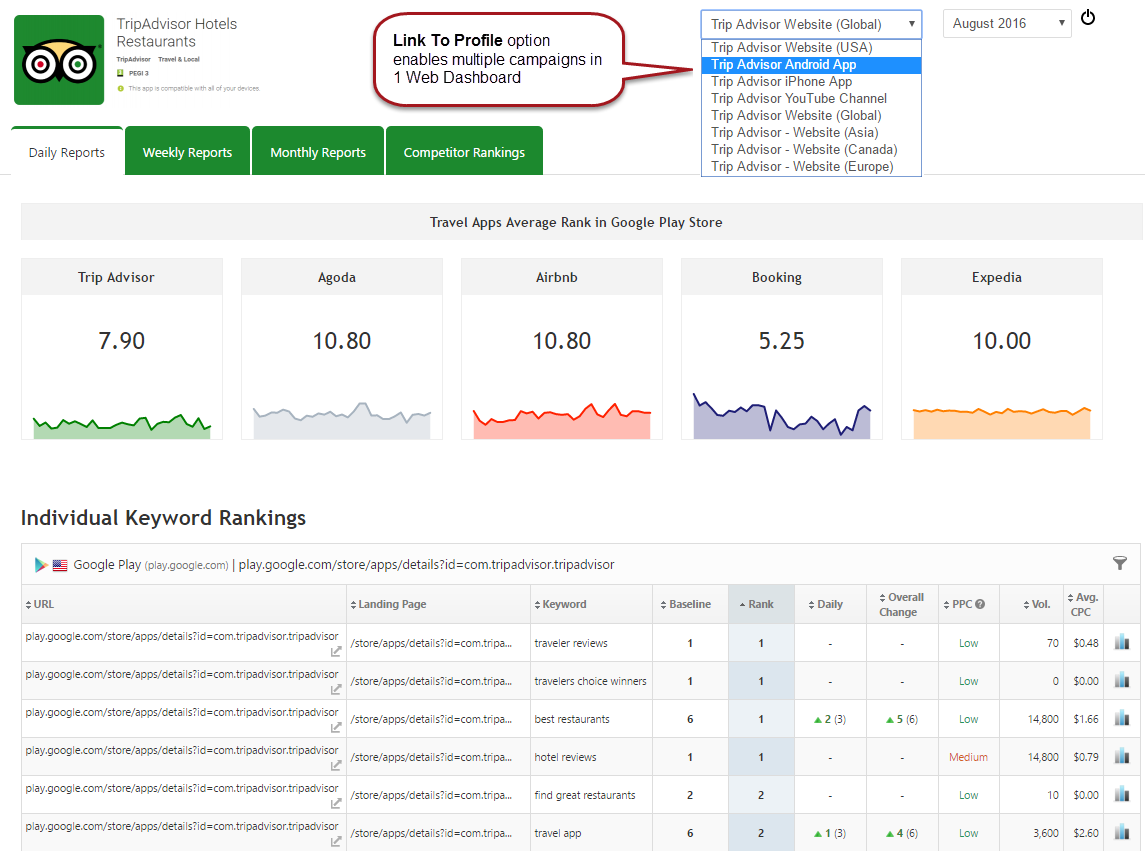
Multiple campaign Single Sign-on
|
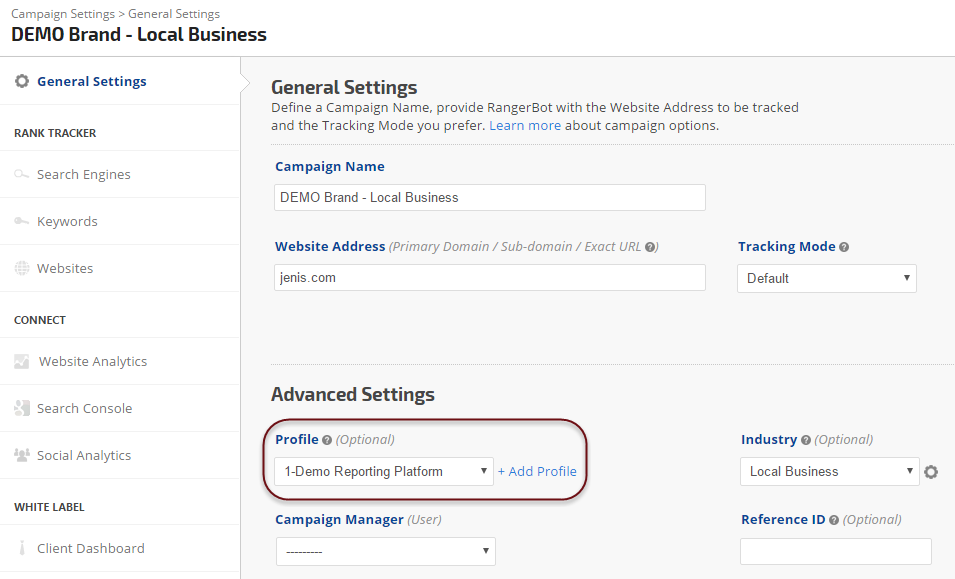
Yes, Profiles can be used to group multiple campaigns for viewing with a single login to a dashboard
|
Yes, Profiles can be used to group multiple campaigns for viewing with a single
log
in to a dashboard
|
Reports & Graphs
|
1 of each Rank Ranger report and graph
|
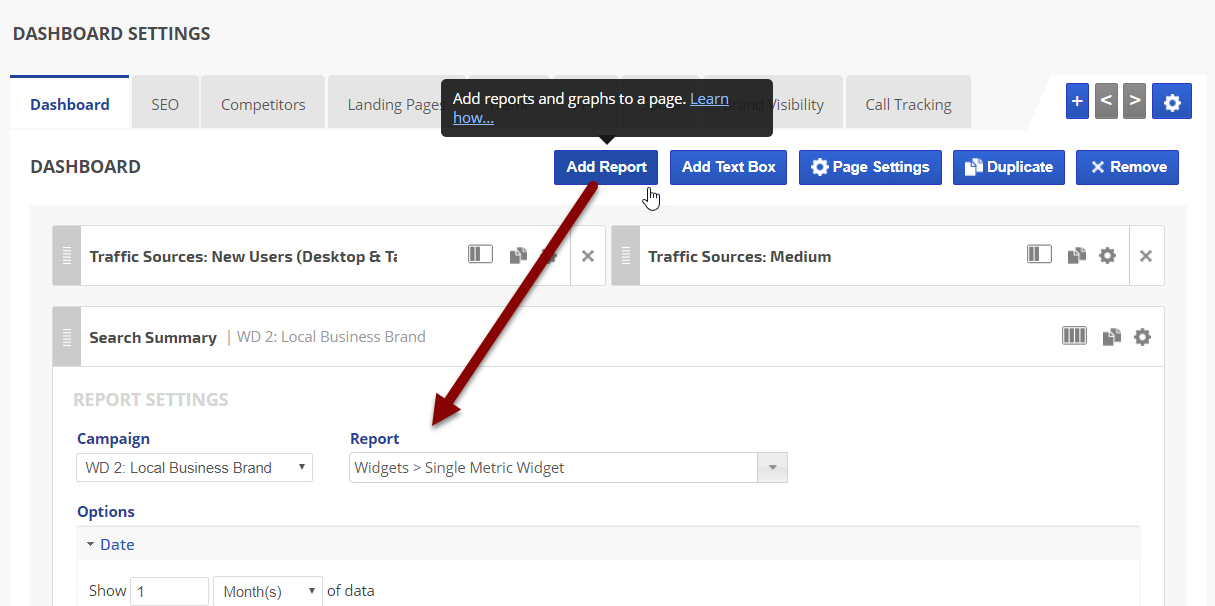
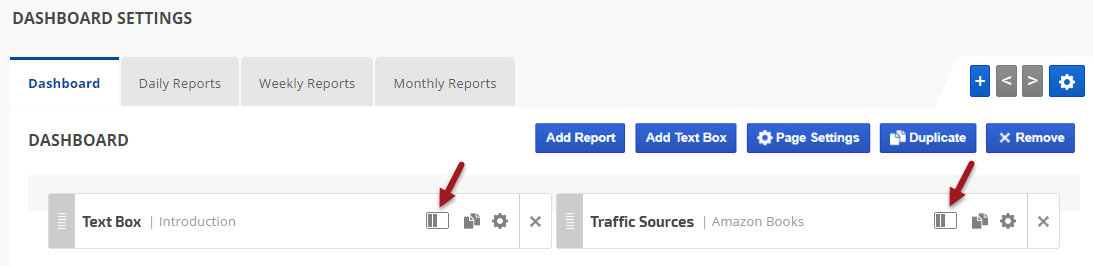
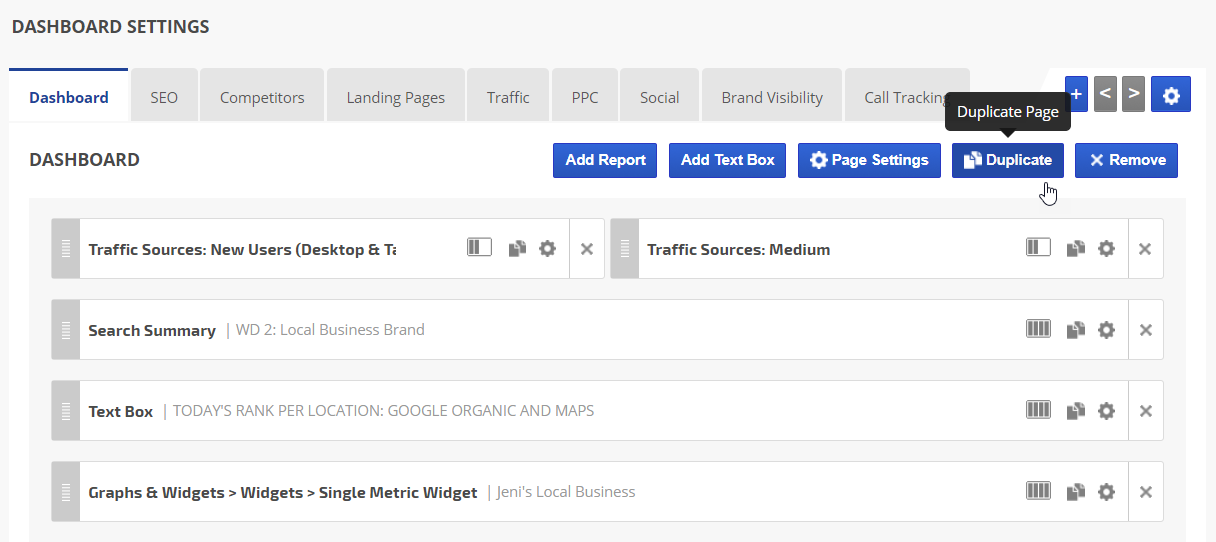
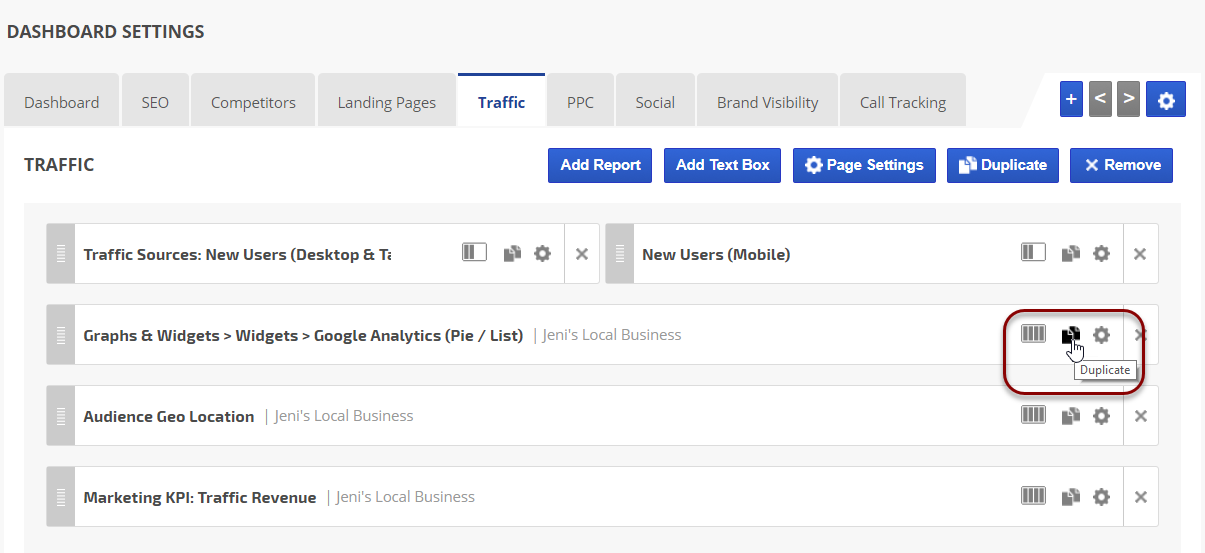
You can add multiple versions of the same report or graph, and organize them in web pages with titles displayed in the navigation menu.
|
Cross-campaign Reports & Graphs
|
No, each Client Dashboard presents report data for
the campaign it is associated with. However, single sign-on to multiple campaigns is possible.
|
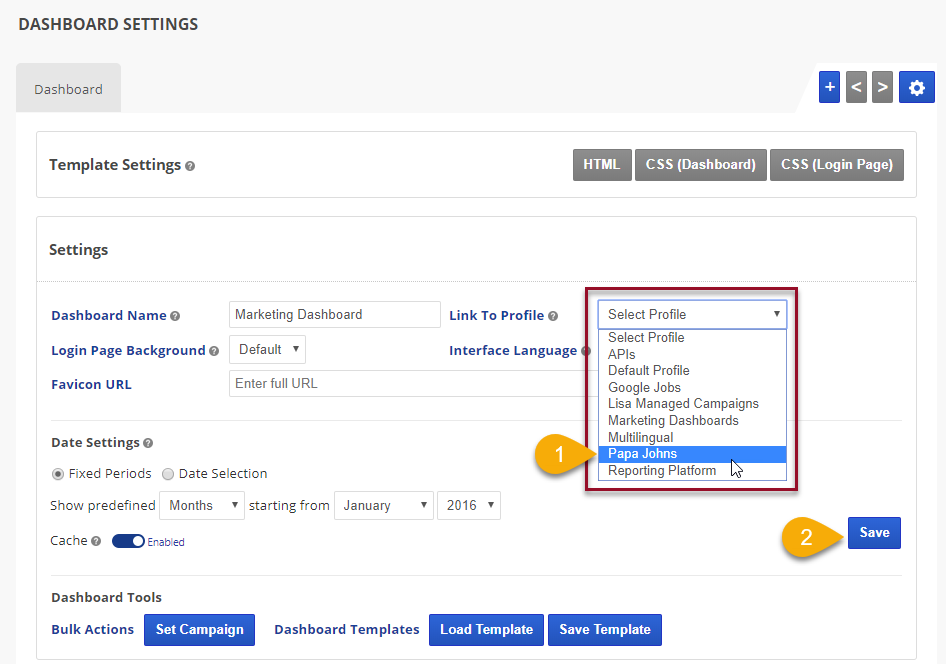
Yes, Marketing Dashboards can contain data for any campaign in the account. For example, it is possible to create a dashboard with data from a campaign for a website, and separate campaigns for the YouTube and the App Store affiliated with the website.
|
Text boxes
|
Not available
|
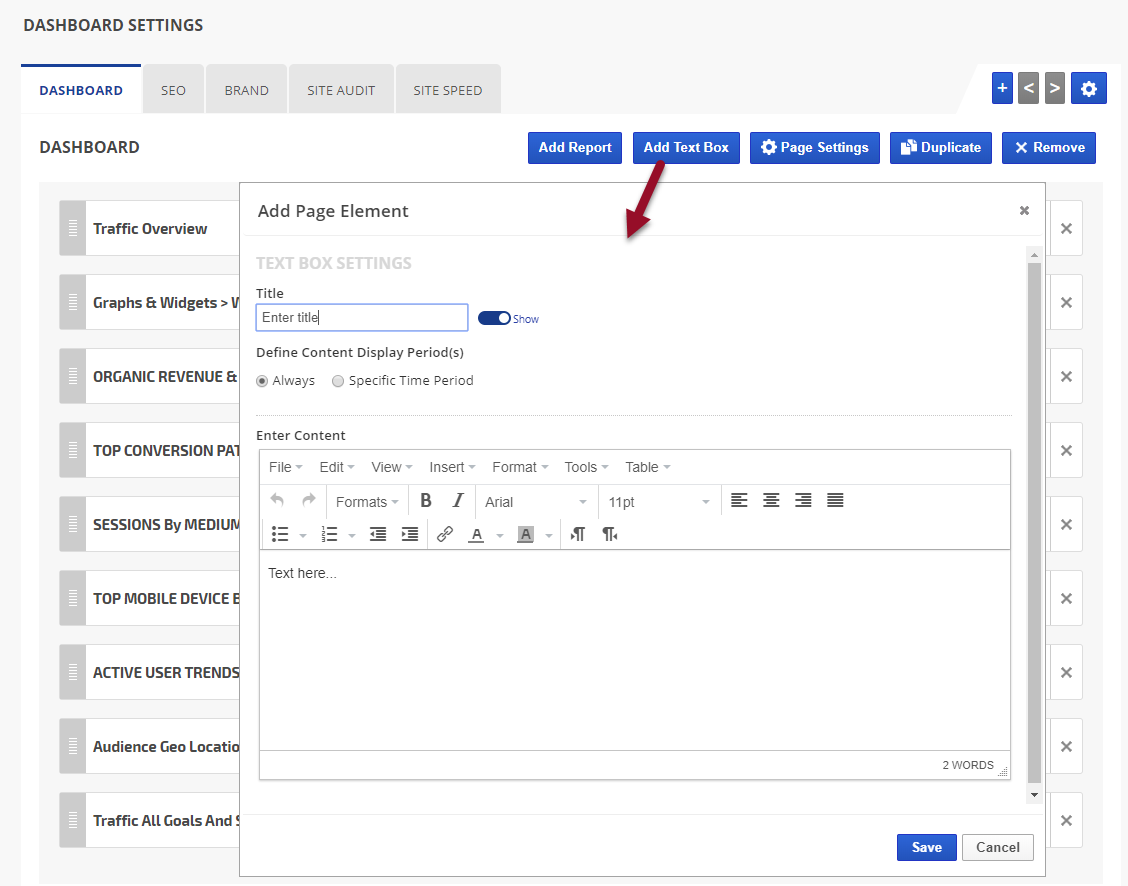
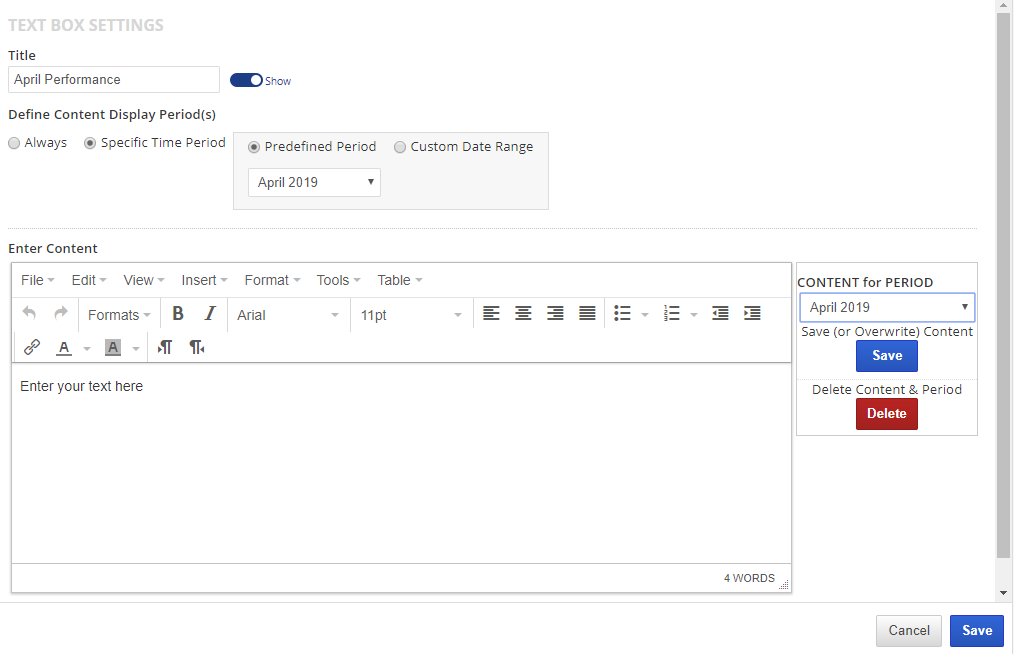
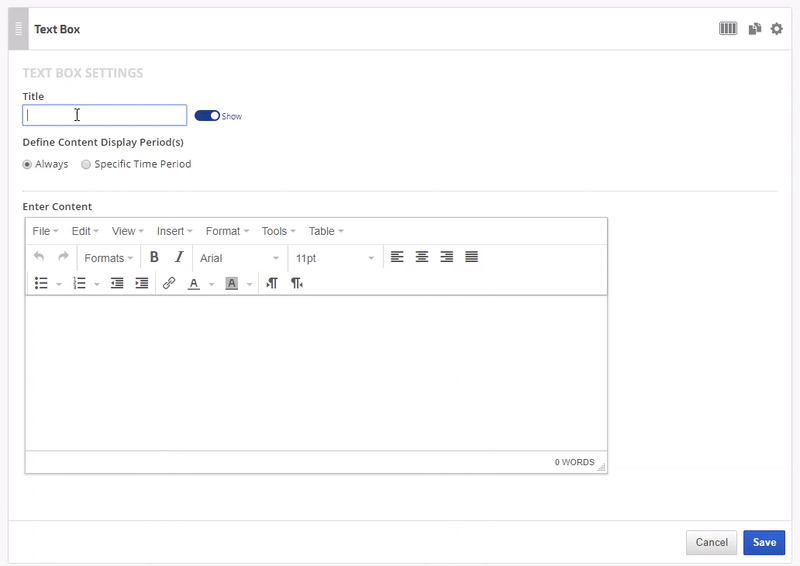
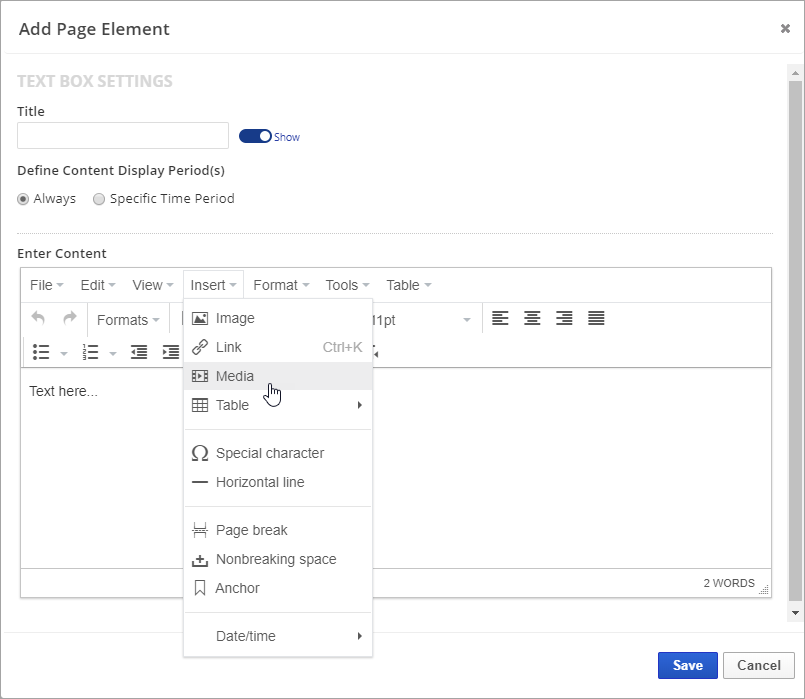
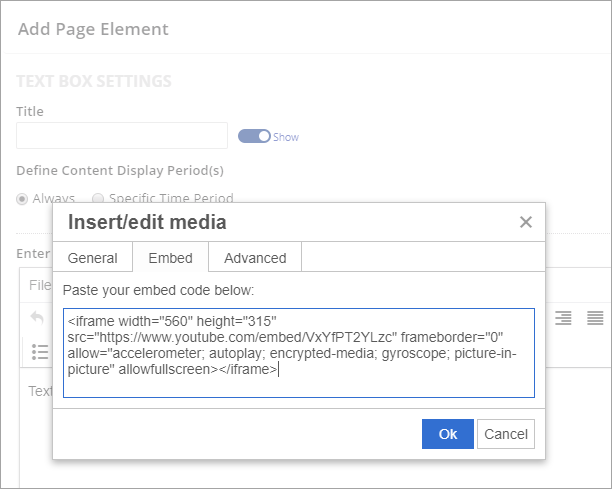
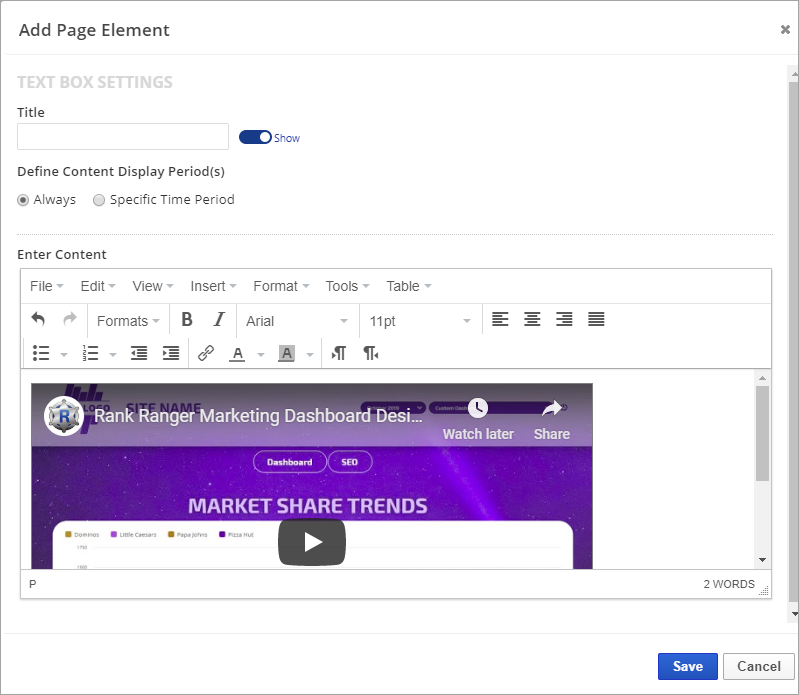
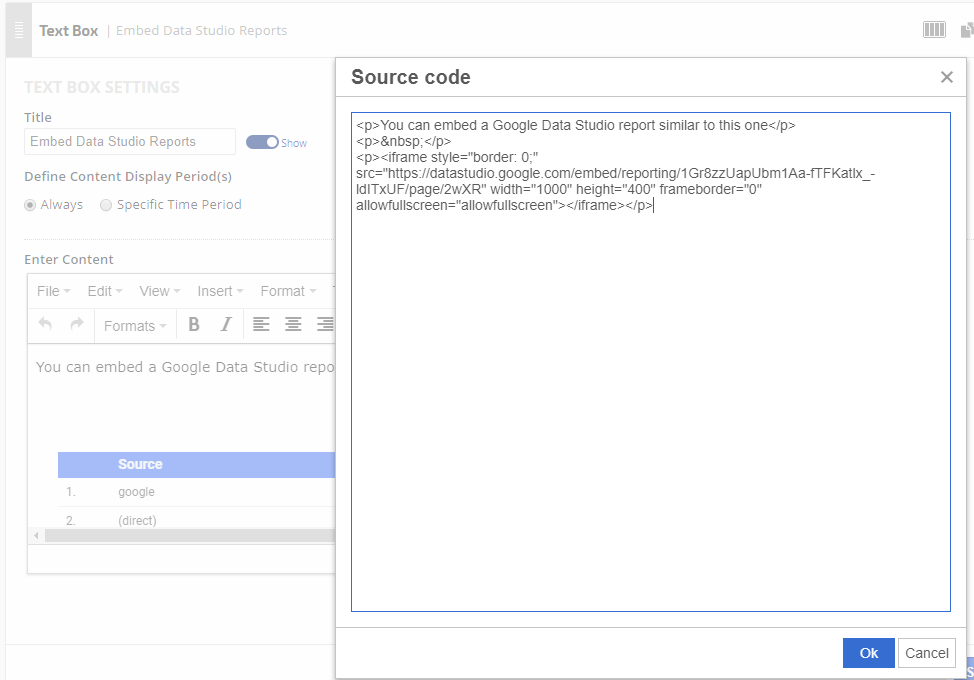
Text boxes can be used to display messages to clients and can be scheduled to display during specific time periods or constantly. They can display before, after, or beside reports and graphs. |
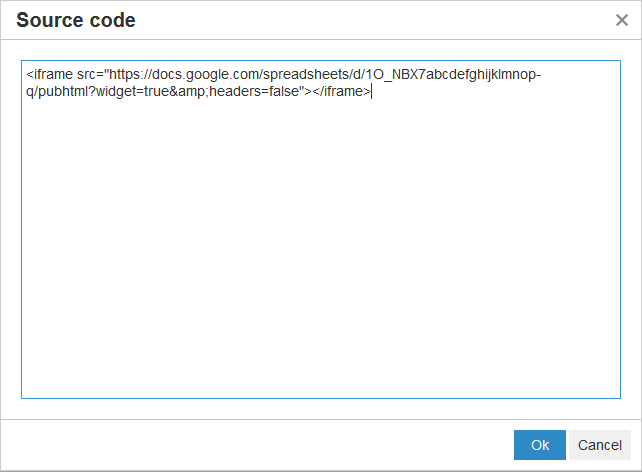
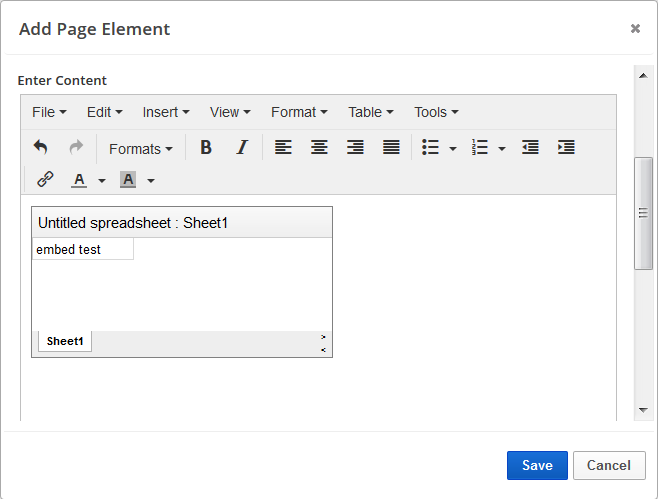
Embed External Data
|
Not available
|
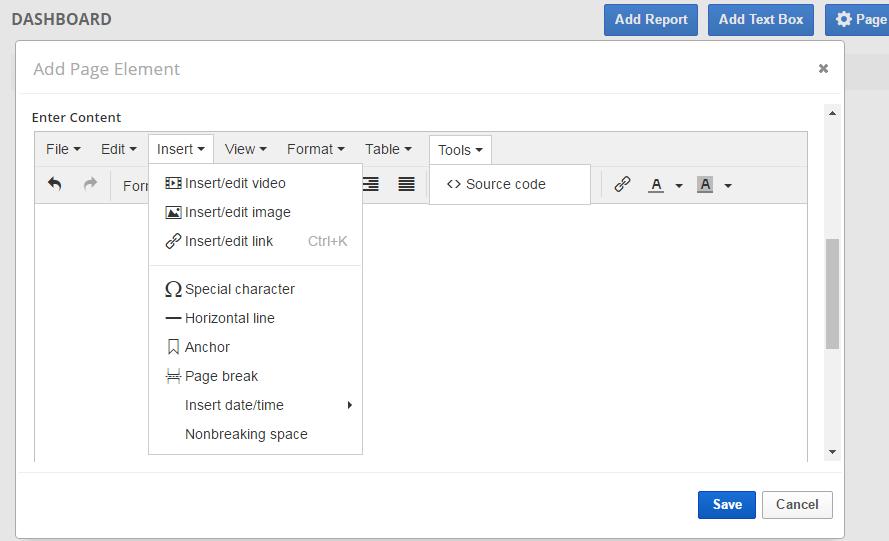
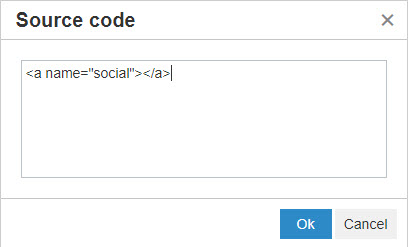
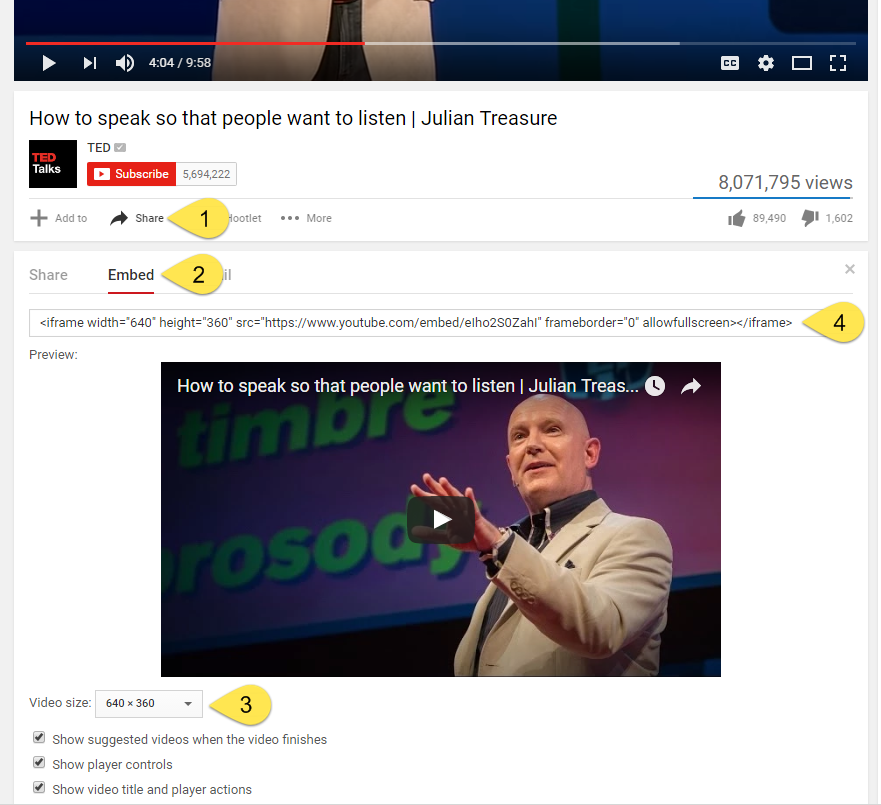
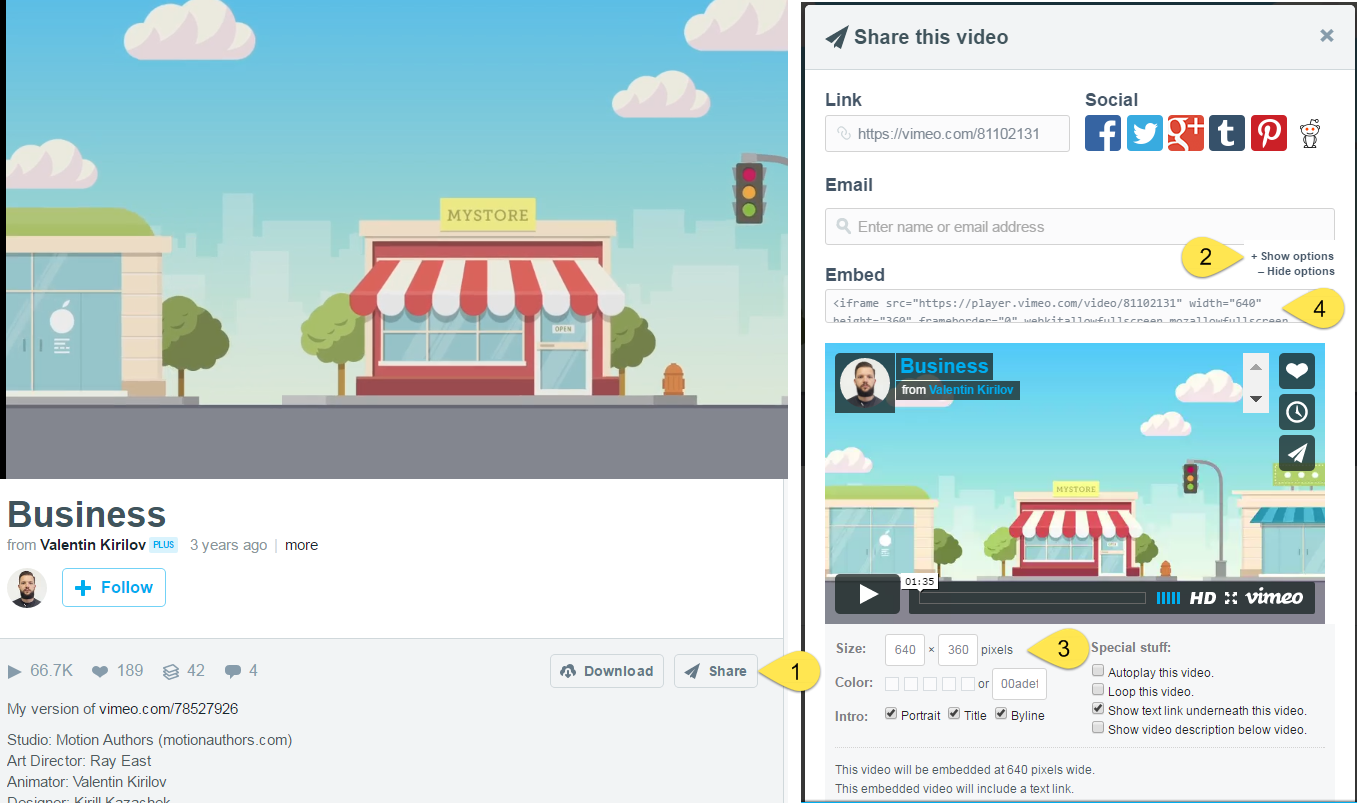
Embed Images, Google Spreadsheets, Presentations, Drawings, and Forms as well as Vimeo and YouTube videos |
| Templates |
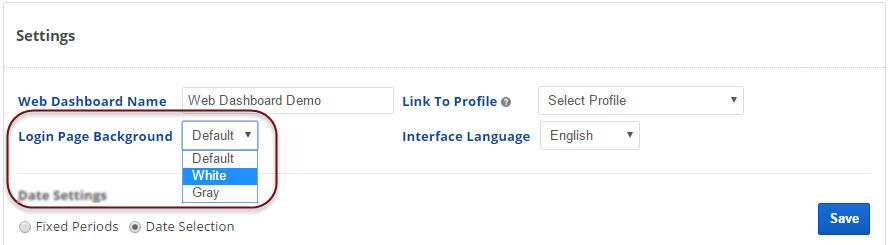
No, however, you can set an account level default for the reports and graphs you
want to be displayed in all Client Dashboards for new campaigns. Additionally, Client Dashboard report default settings can be created for each report per campaign.
|
Yes, you can select from a variety of built-in design templates, launch one of our templates and edit it to fit your needs, or create and save your own design and content templates that can be applied to other campaigns.
|
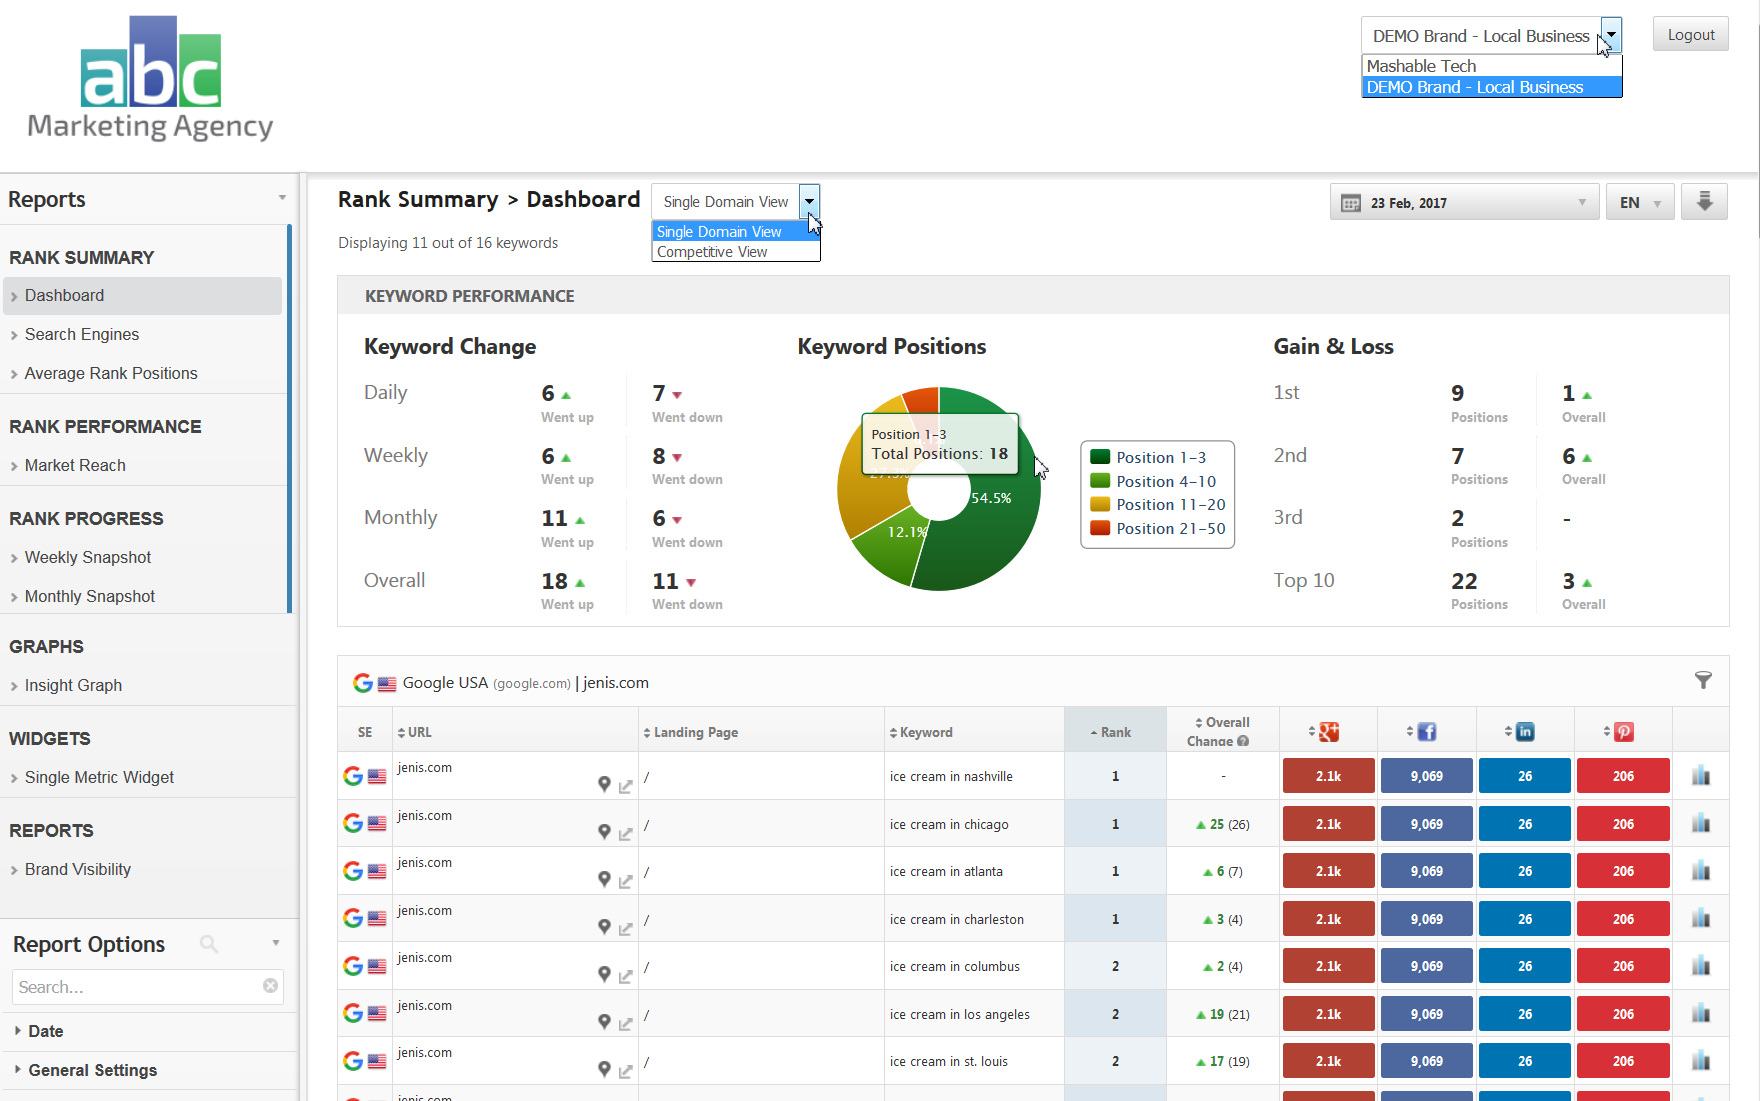
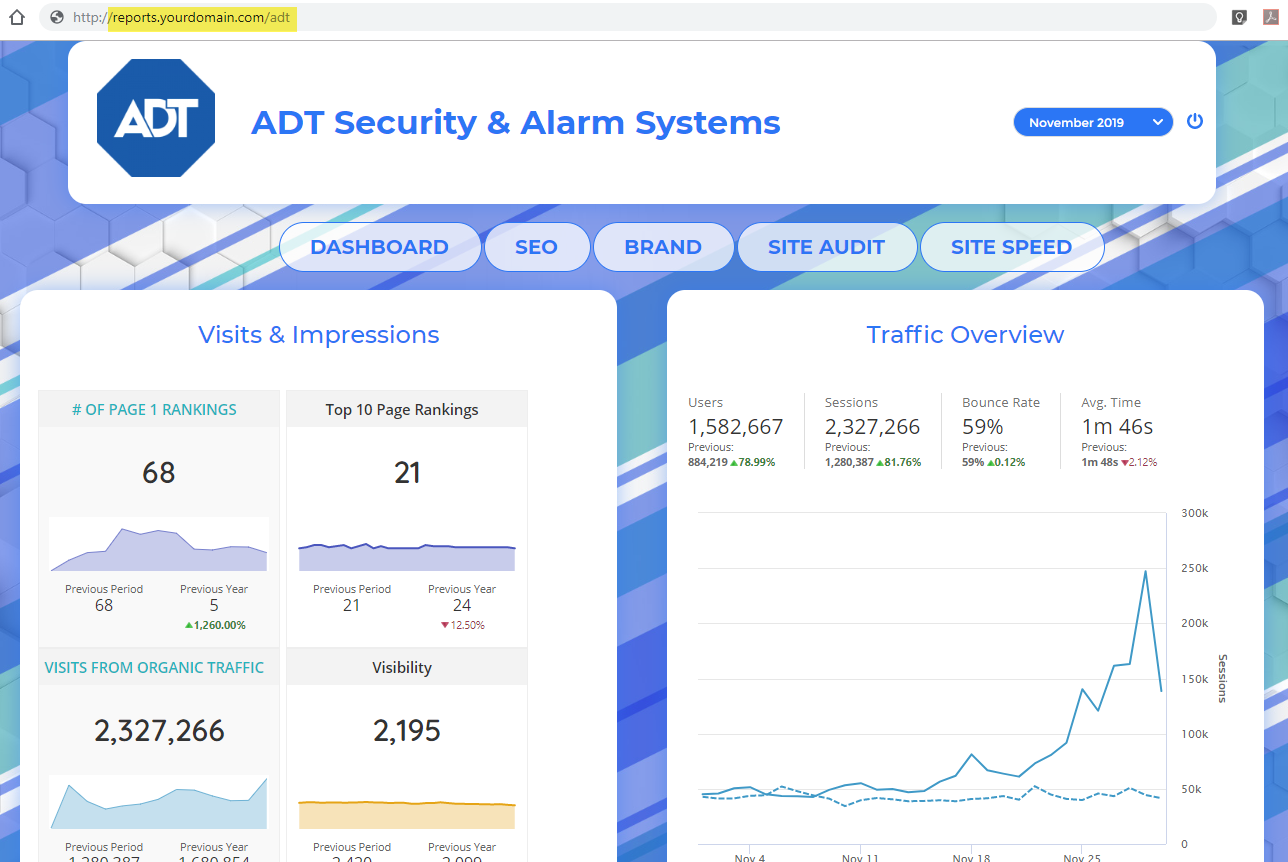
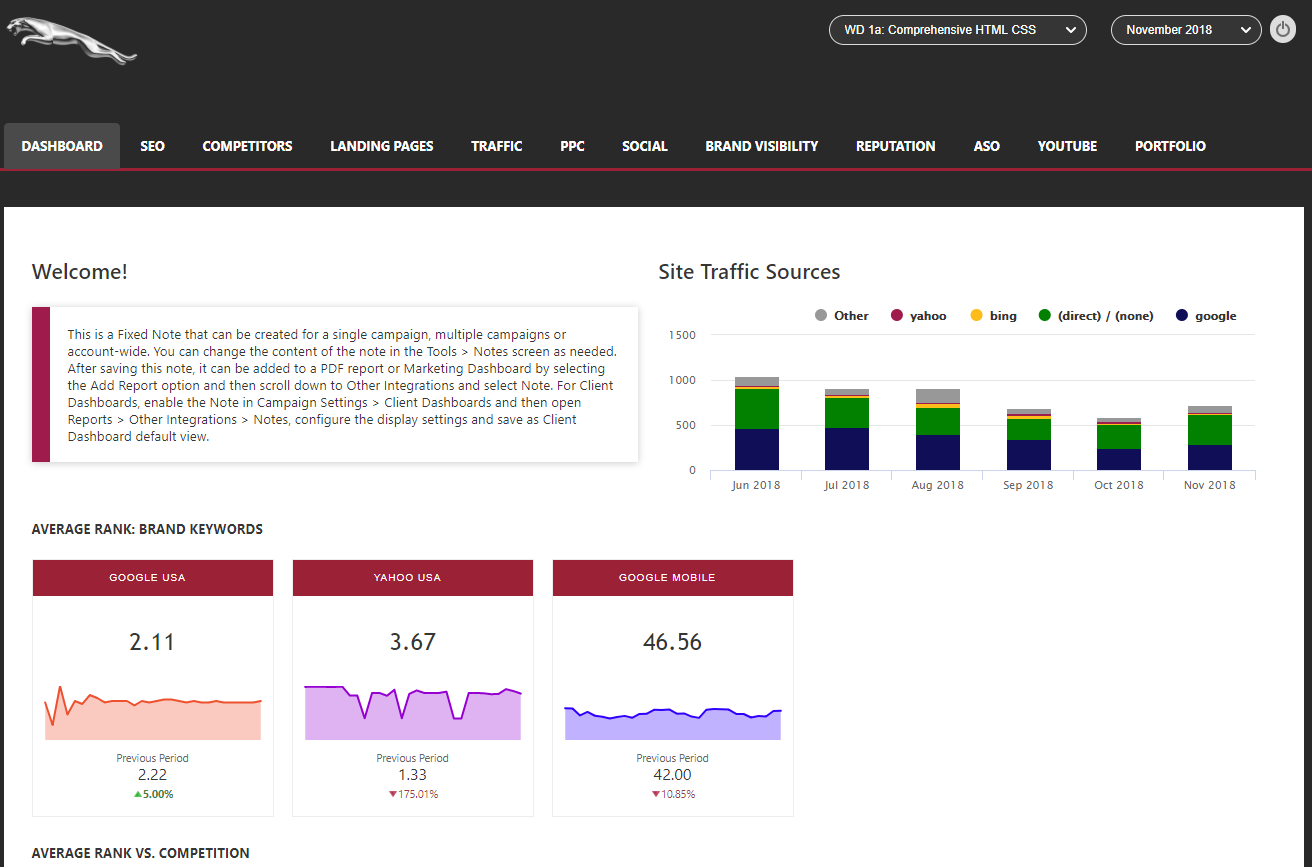
Demo Dashboards
Client Dashboard example
Experience a live Client Dashboard with multiple campaign single-sign on feature, that uses a Public URL access
(no password required)
|
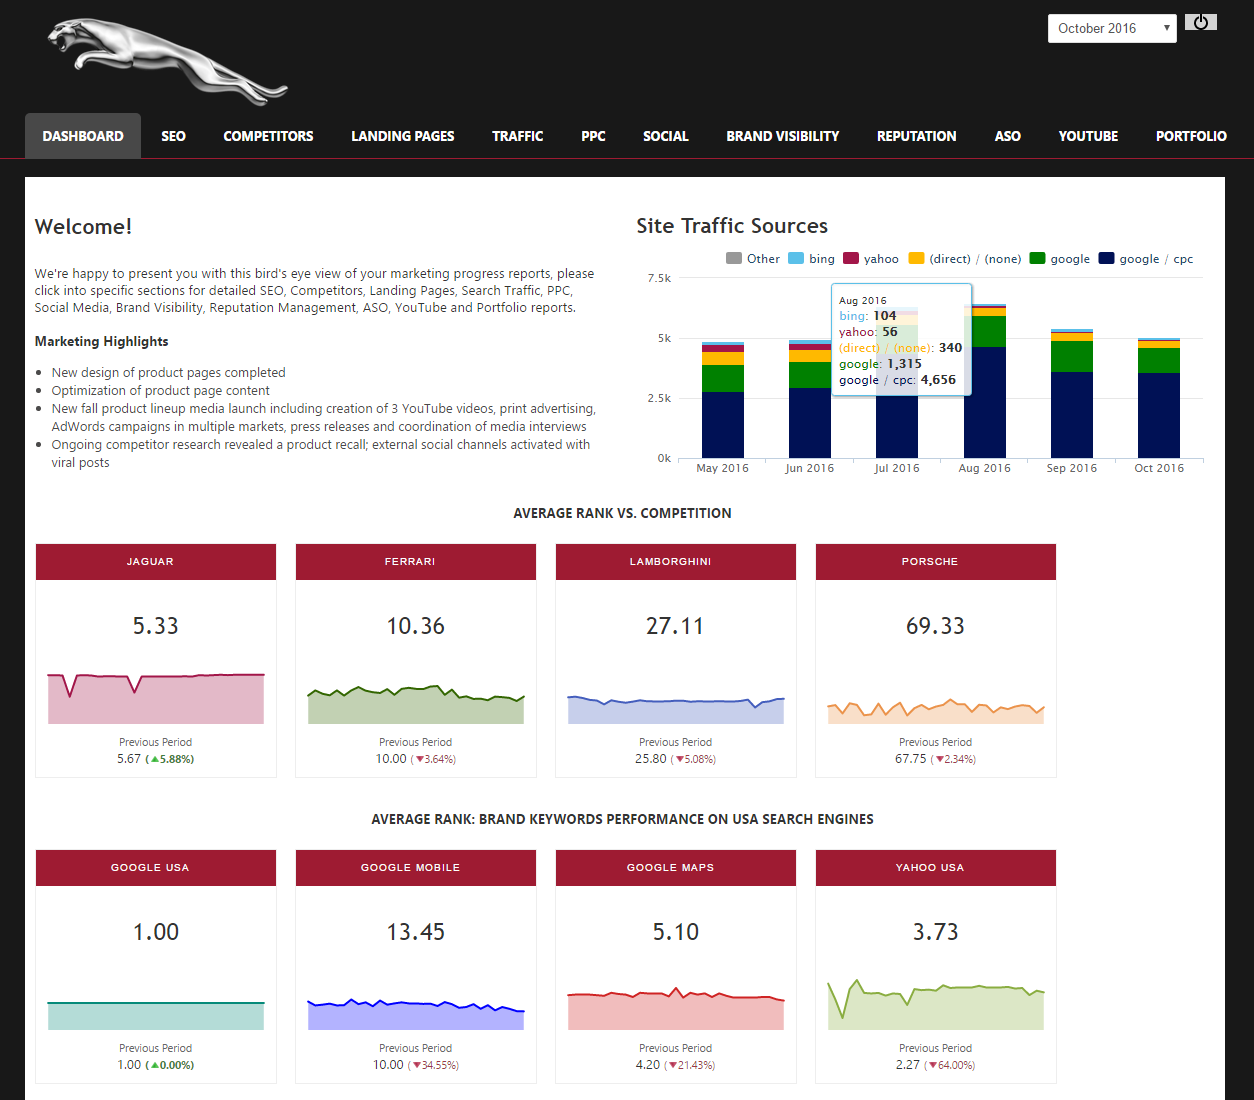
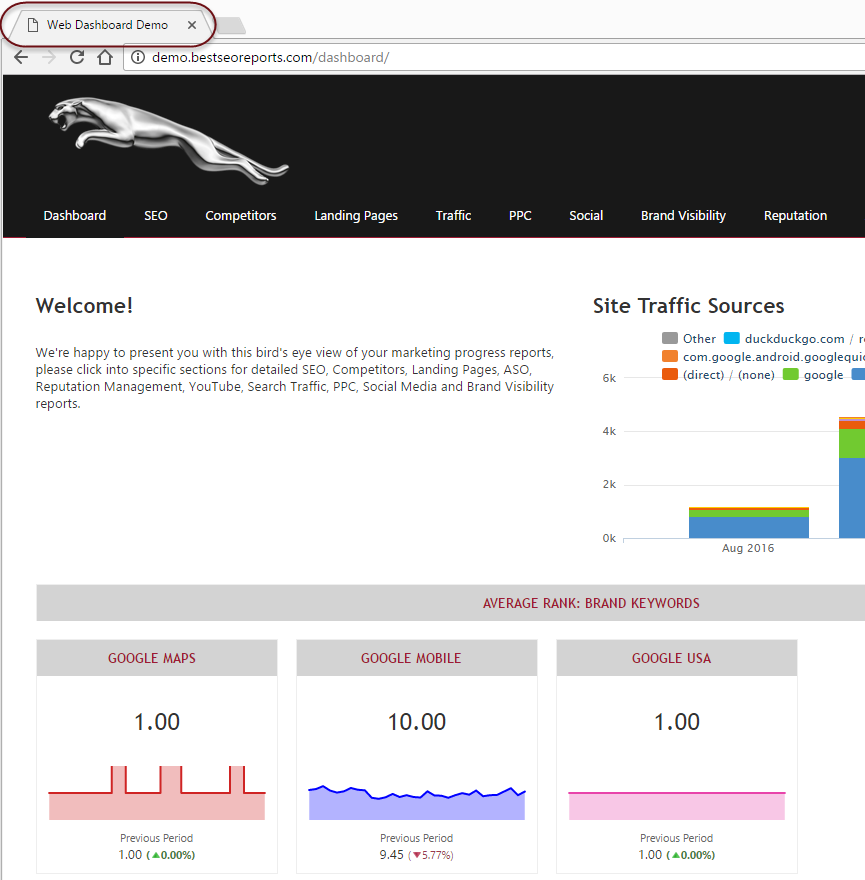
|
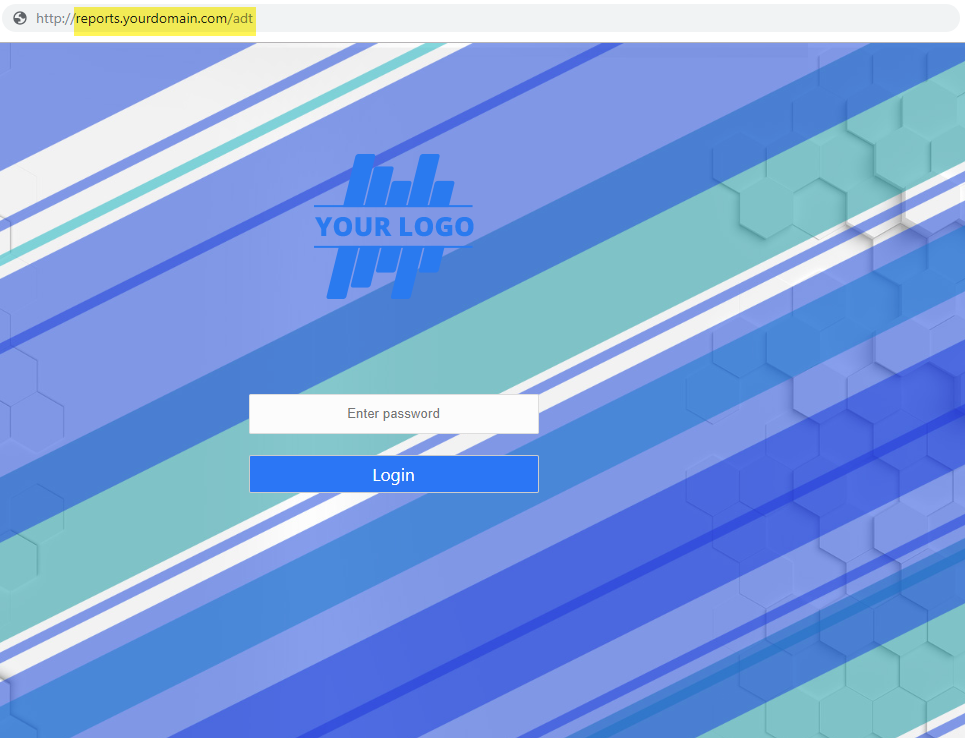
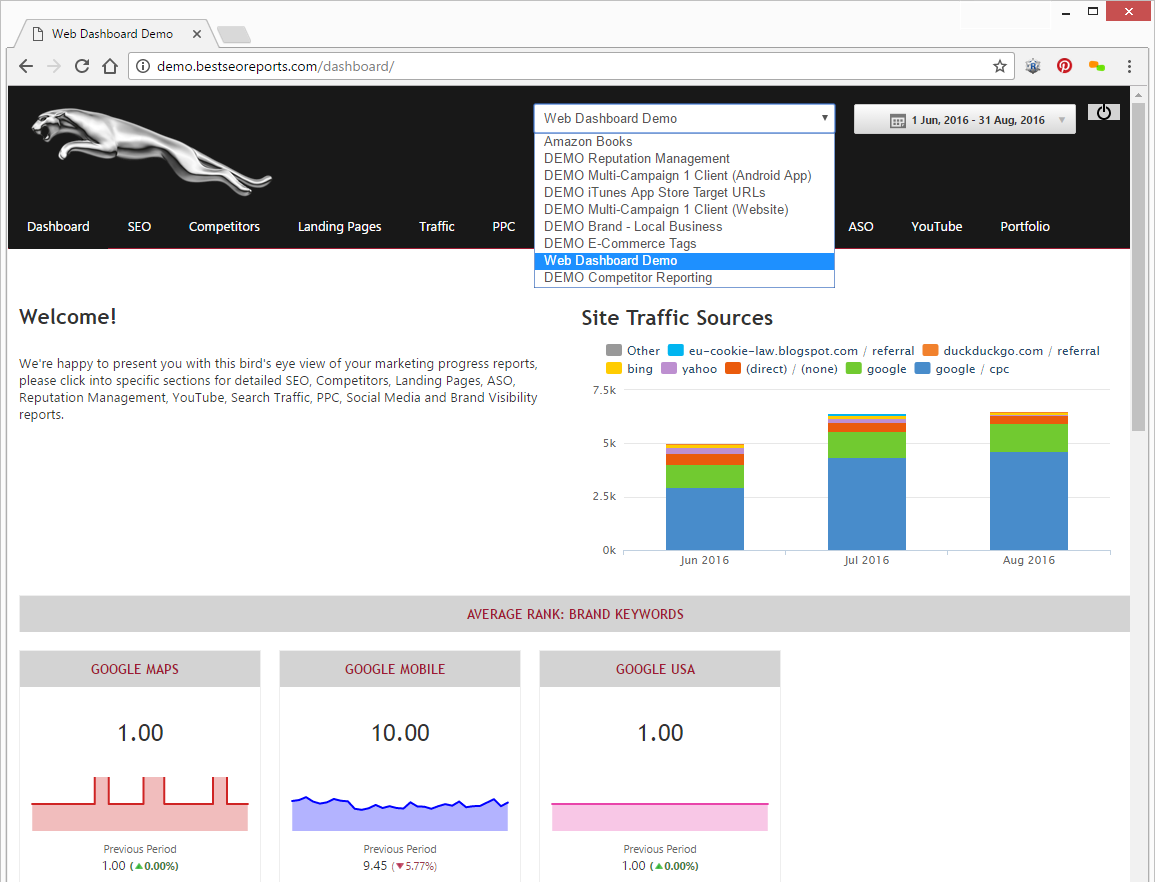
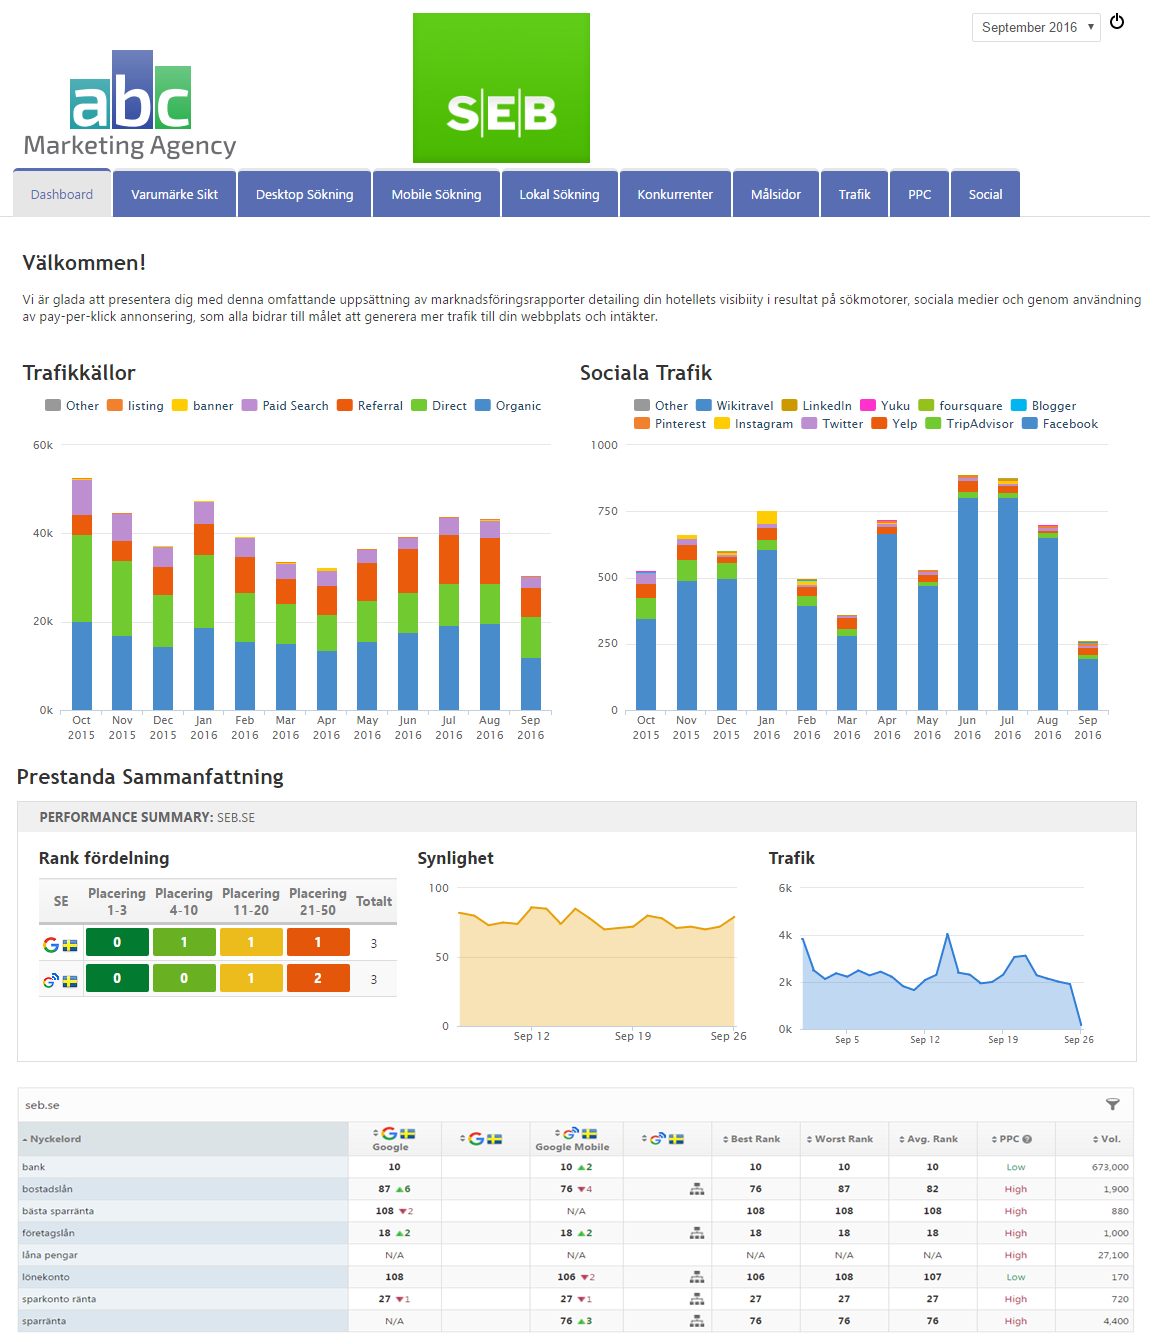
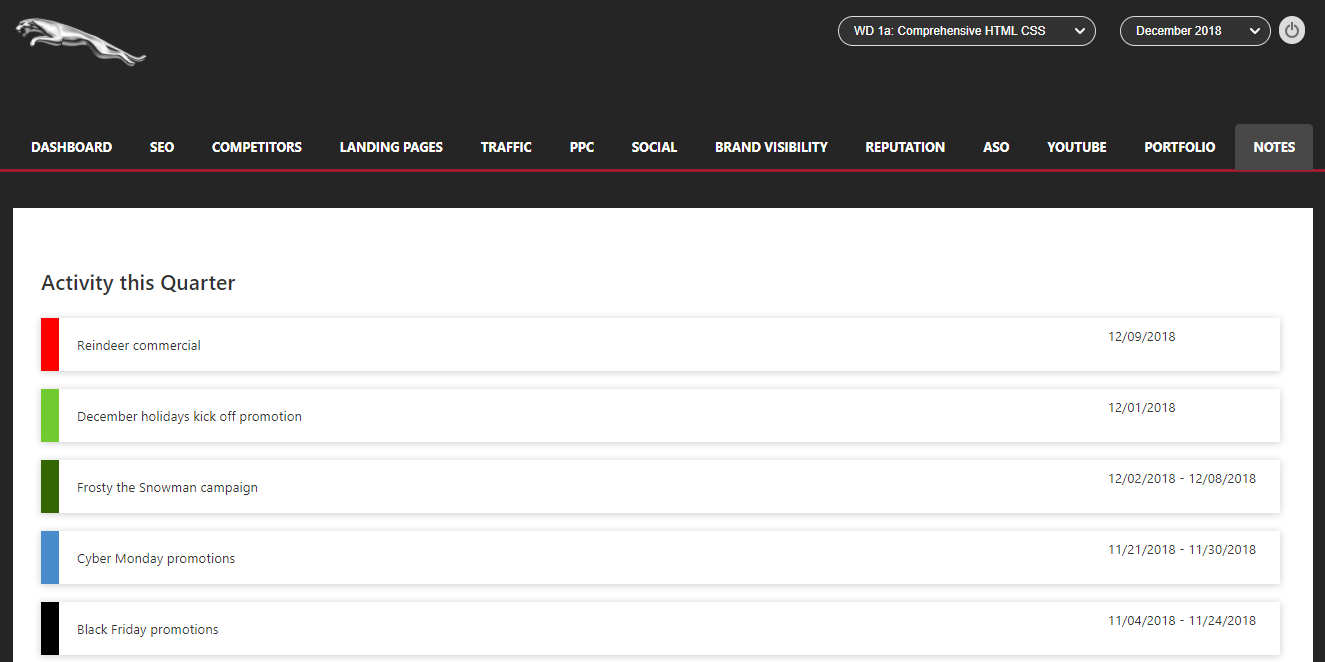
Marketing Dashboard example
Experience a live Marketing Dashboard demo with a single sign-on feature, that uses secure login access
(password: demo)

|
Marketing Dashboards are a premium feature that can be subscribed to in stand-alone marketing dashboard plans or added to full reporting platform plans. If your current plan does not support Marketing Dashboards and you would like to take advantage of this game-changing feature, please log into your account and complete the
Build Your Own Scalable Package form at the bottom of the
Add New Package screen and we'll be happy to provide you with pricing and build a custom plan that meets your current requirements and is expandable for future growth.


