Search our Knowledge Base
Search

Rank Tracker Dashboard


The Rank Tracker Dashboard report provides you with a complete overview of your primary domain, as well as your competitor URLs, and is rich with options including Rank Change filters, Keyword Metrics, Domain Metrics, Landing Page Metrics including social signals, and more. The multiple view feature allows for a customized single domain and competitive views.

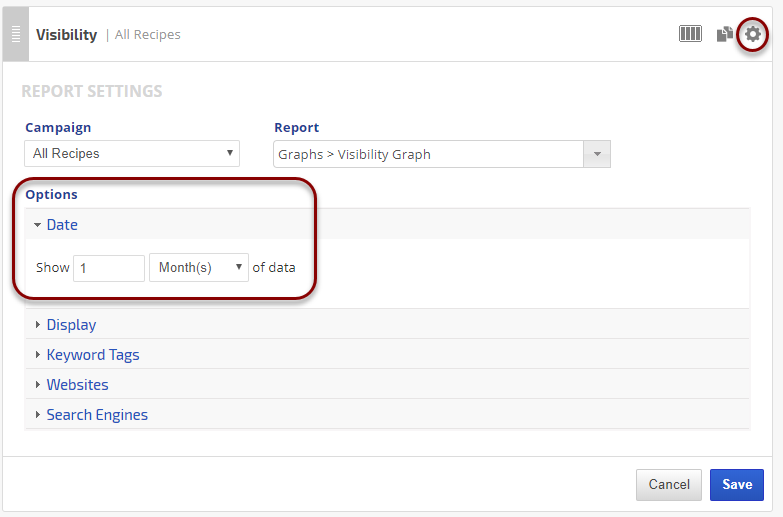
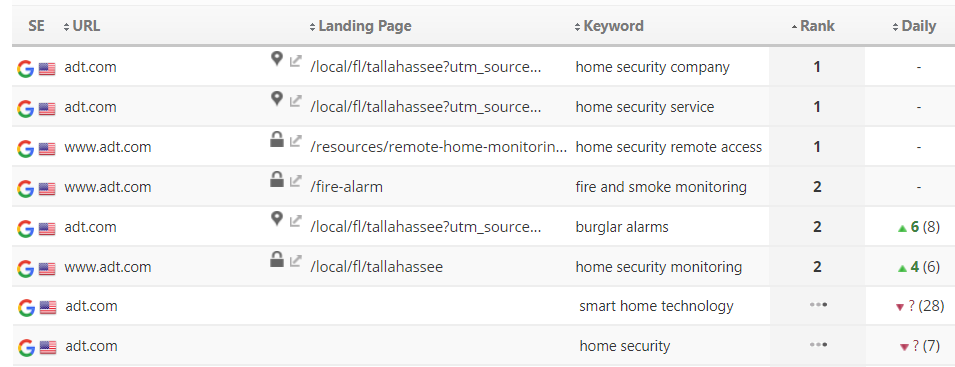
Customize Your Dashboard


Add a custom report title, show or hide the display of search engine, domain, landing page, baseline rank, best rank, daily rank change, weekly rank change, monthly rank change, overall rank change, and targeted URL columns.

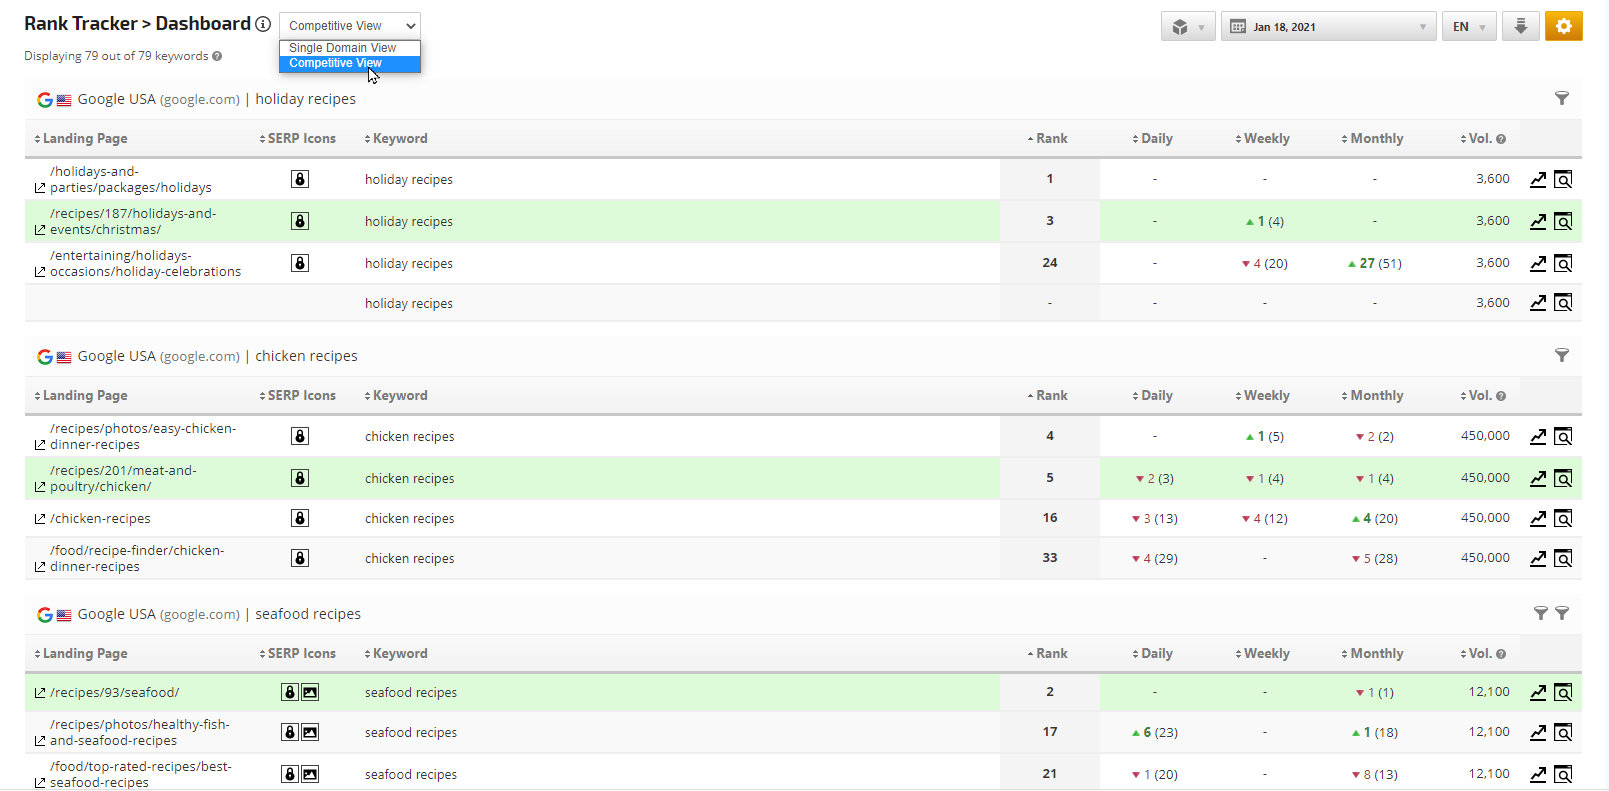
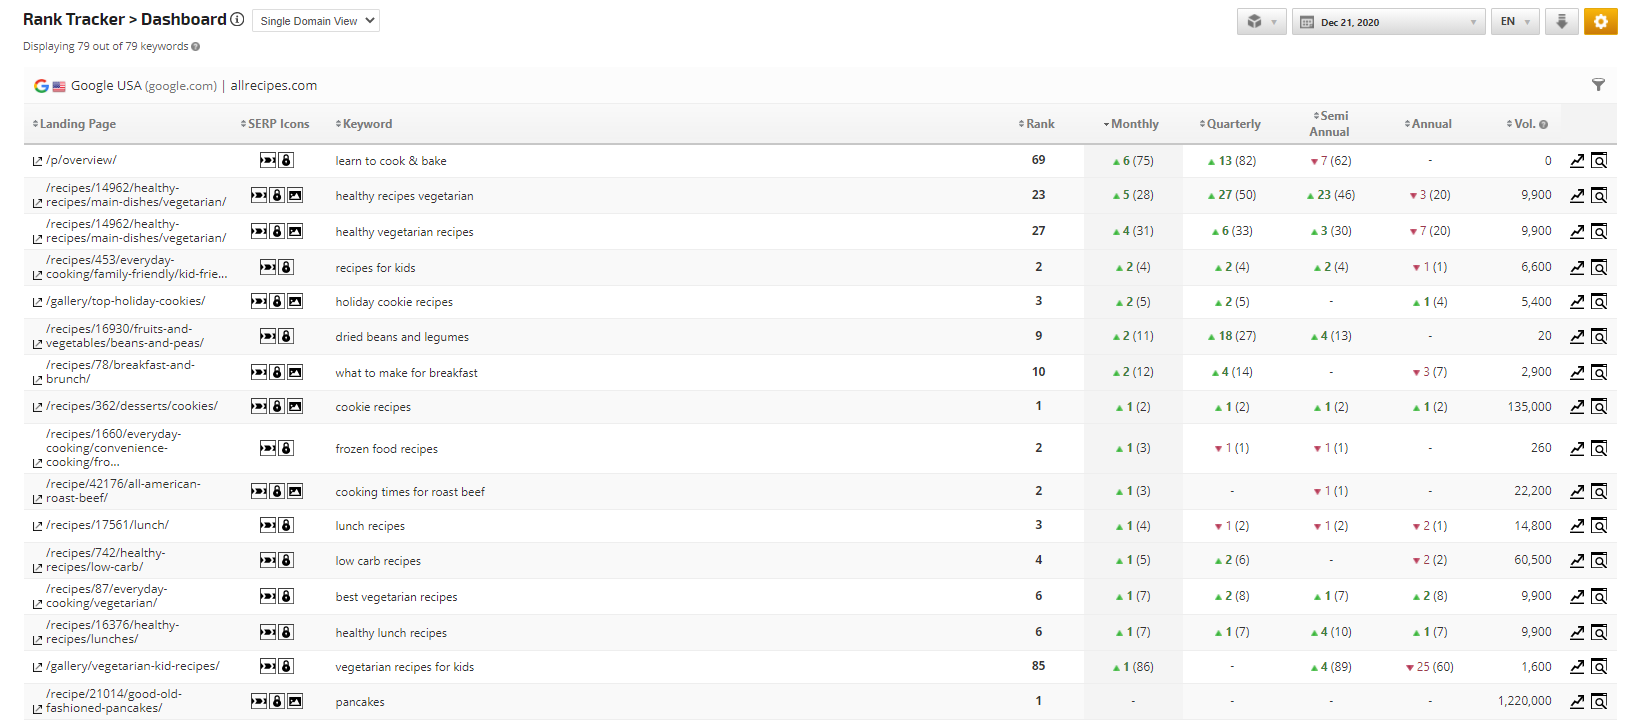
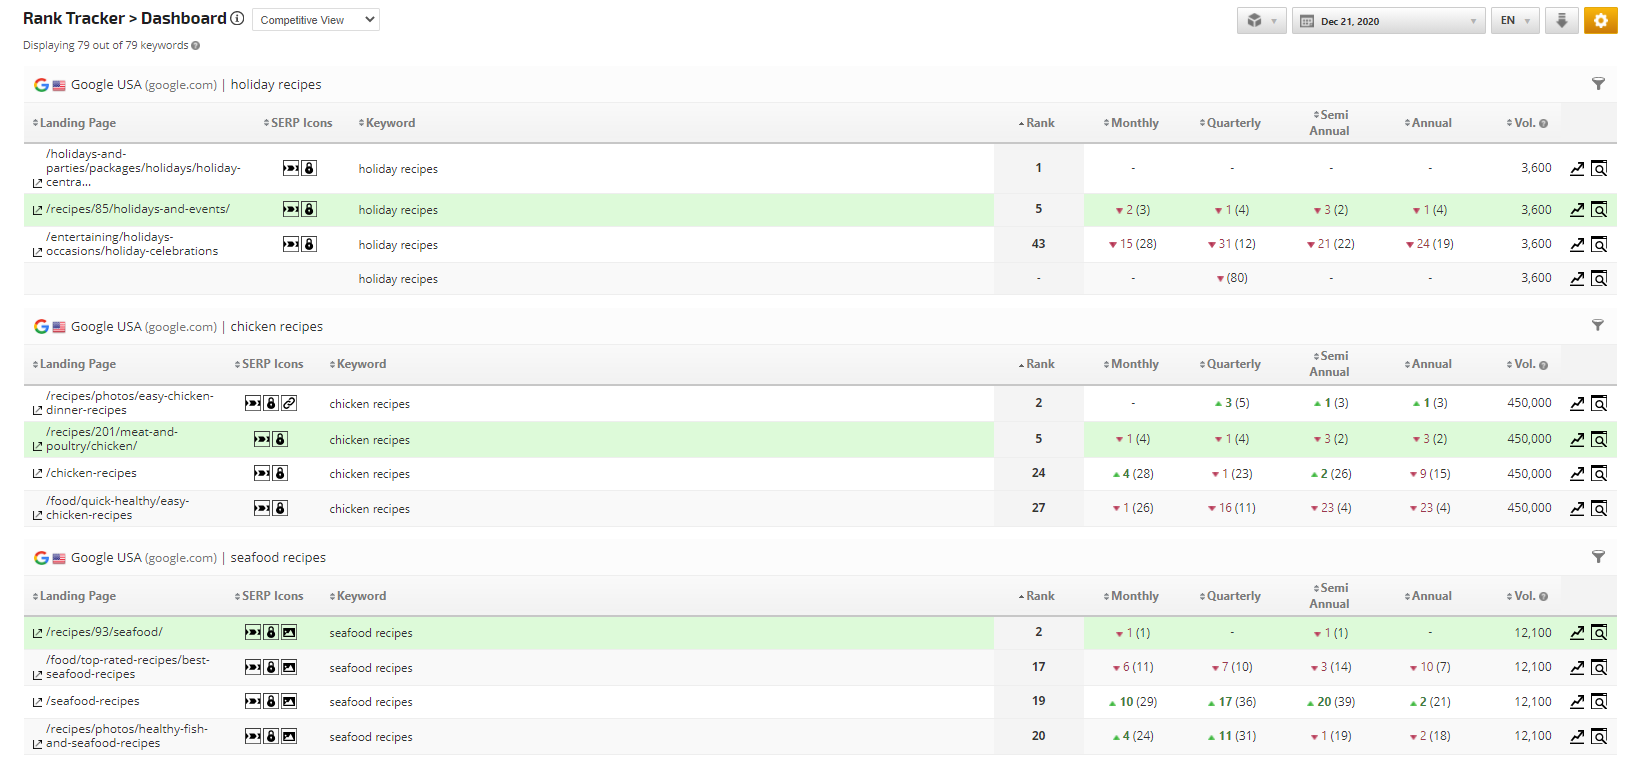
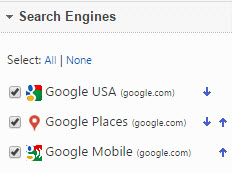
Filter results based on the type of rank change, search engines, display only the top 10, top 20, ... top 100 results, or only certain keyword categories using tags, and compare results to the previous day, week, or month.

Choose from a variety of:
  • Keyword Metrics: Google AdWords average monthly volume, average CPC, PPC competition, KEI, and algorithm change
  • Domain Metrics: Google Page Rank, Majestic, Ahrefs & Moz
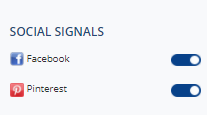
  • Landing Page Metrics: Social Signals 
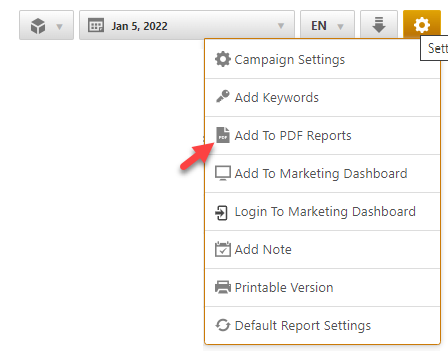
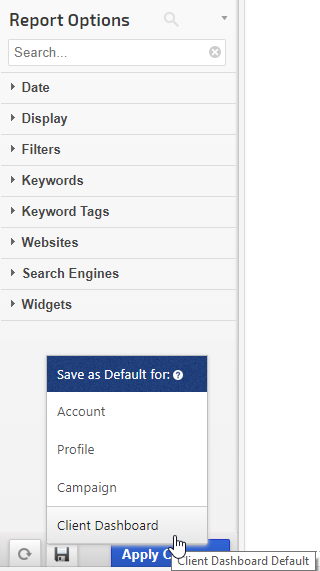
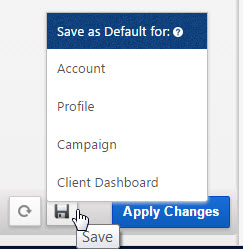
Data for any keyword and search engine combination can also be displayed in a visual graph.

Use Report Presets Report Presets save multiple report versions to save multiple versions of the Dashboard for each campaign.

When you've customized a report exactly the way you want it, you can save it as the report default settings for your Account, a Profile, only this Campaign or the Client Dashboard that corresponds to the campaign.

Rank Tracker Dashboard

Reports & Tools > Organic Search > Rank Tracking 


SERP Snapshot and SERP Indicators


When Google displays answer box, events, local pack map, news, notable online, ratings, search box, site links, or video features in the search results for your keyword and site, the Rank Tracker Dashboard places special SERP icons in the URL field to alert you to the special results. Learn more...

SERP Snapshot

Click the Discovery Screen icon SERP discovery screen to display the Top 10 Organic search results for the keyword. Scroll down and discover the Top AdWords Ads and Google Related Search phrases (if Google served any for the selected keyword).
Note: Not all SERP Snapshots show current data. Please pay attention to the date of the snapshot in the top right corner. Due to this, the Rank column data might not match with the snapshot data.

SERP Snapshot in Dashboard


SERP indicators that can be viewed in the Dashboard include:

SERP indicator icons


Dashboard SERP Indicators Example

In this example of the Rank Tracker Dashboard, the URL column is displaying ratings, events, and SERP indicators.

Rank Tracker Dashboard with SERP icons

Competitor Rank Tracking and SERP Features Comparison

In this example, the Competitive View of the Rank Tracker Dashboard provides not only rank, rank change, domain indexed pages, and backlinks, but also an indication of which SERP features are displayed in the search engine results for the keyword per domain and an option to view a SERP snapshot per keyword.


rank tracking competitors

Filter Rank Tracker Dashboard by SERP Feature

In Report Options > SERP Indicators, you can select specific search engine results page indicators and filter the rank tracking report to display only the results that contain one of the selected SERP icons by choosing the "Contains at least one (OR)" option. 

In this example, we selected AMP OR Carousel, Featured Snippet, Image Thumbnail, Rating, Structured Snippets, or Video Thumbnail, and so we see all results that contain any of these SERP features.  If AND had been selected, then the report would only display keywords that contain all of those selected SERP features.

Rank Tracker Dashboard SERP features


To view only the results that ranked with a particular combination of SERP features, select "Require all selected (AND)". In this example, we selected Image Thumbnails AND Recipes.     
        
filter rank tracking report for SERP feature


Featured Snippet Rank Tracking


Featured Snippets become Rank Position 1
On January 23, 2020, Google changed the way Featured Snippets vs organic rank are treated in search results (learn more...). Featured Snippets are now considered to be a rank position 1 and the link displayed in them is no longer repeated as a separate organic result on page 1. As such, due to the prominence of the featured snippet's visibility (and potential for click-through), we have adapted our tracking to include Featured Snippets as rank position 1 when a keyword we're tracking for you displays a URL in it. 

To help you determine if a keyword ranked in position 1 with or without a Featured Snippet, we have added a report option that you can enable to display a column labeled "FS". When the result is a Featured Snippet, a "1." icon displays in that column.

Featured Snippet postion 1

Featured Snippet Indicators in Dashboard Report
In this example:
  • outlined in green, the SERP Feature icon for a Featured Snippet is displayed in the URL column, the keyword is ranked in position 1 and the SERP Snapshot shows the Featured Snippet URL
  • outlined in blue is a keyword ranked in position 1 without a Featured Snippet

Featured Snippet


Single Domain & Competitor Dashboard


Single Domain View

Select Single Domain view from the menu to view data for selected keywords for a domain per search engine. Active Filters such as keyword tags, search volume, minimum and maximum rank, landing page, etc. are indicated at the top of the report, along with the number of keywords displayed based on those filters.

SEO Dashboard Single Domain View


Competitive View

Select Competitive View from the menu to view keyword rank and SEO metrics for each domain you're tracking.

SEO Dashboard Competitive View


Rank Trend Baseline Comparison


Baseline Comparison

Enable the Baseline and Overall Change columns (in Report Options > Display > Rank) to display the overall change between the rank on the 1st day the keyword was added to the campaign* (baseline rank) and the current report date rank.
  * If the keyword did not rank within the maximum supported results tracked by each search engine (refer to our current list of supported search engines for rank depth and additional information) on the day it was added to the campaign and was not manually imported, then Baseline displays 100 on the days when the keyword ranks.

Compare Baseline Rank to current Rank

Quarterly, Semi-Annual, & Annual Rank Trends


Enable the Quarterly, Semi-Annual, and/or Annual columns (in Report Options > Display > Rank) to view rank comparison between current report date and previous periods.
Dashboard Rank Trends for Single Domain


Dashboard Rank Trends for Competitor Domains
This keyword rank comparison over time between competitors is possible by selecting Competitive View (enable the display of the Website column in Report Options > Display > General)


Best Rank


Best Rank

In Report Options > Display > Rank, set Best Rank to display and a column will be added to the report that displays the highest rank a keyword has achieved since it was first tracked for the primary domain. Compare the best rank with the current rank and baseline to gain rank insights.

Rank Change options


Rank Tracker Dashboard Best Rank


Best Rank in Competitive View

Switch to Competitive View and set the Best Rank column to Show, and you'll be able to view the top rank your competitors have been able to achieve for your keywords since you began tracking the campaign.

Best Rank in Competitor View of Rank Tracker Dashboard


Keyword Difficulty

 
Keyword Difficulty View

Keyword Difficulty is the most important metric for SEO research and is displayed as a Score from 0-100. The higher the score the more difficult it is to rank for the keyword. Learn more...

Dashboard displaying Keyword Difficulty


Target URLs

 
Target URL View

Target URLs are set up in Campaign Settings > Keywords. This feature is especially helpful for large campaigns involving websites with multiple services or location-based sub-directories for businesses like real estate, hotels, restaurant chains, etc., and also for tracking YouTube videos or apps in iTunes or Google Play Store.  When the targeted URL isn't ranking, a red X displays with a launch icon to open the Landing Page Monitor for the specific keyword. If other URLs in the tracked domain are ranking in the top 20 results for the keyword, a trend graph and list of URLs displayed in that report (learn more).

Dashboard displaying Targeted URL feature


Rank Performance Graphs


Rank Analysis Graph

Click the graph icon Graph icon opens a graphic display of rank tracker dashboard results for any keyword in the far right column (next to the screen icon) for a visual display of the rank tracker dashboard report data. When the icon is clicked, a graph displays offering a variety of view options (Rank, Rank / Visibility, Landing Page Monitor, and SEO Monitor). To see the detail of a change hover over any area on the graph for the specific date that you are interested in.

Rank and Visibility
This view displays Google Algorithm updates, any notes you entered relating to this campaign (if set to the display position in Report Options), and the rank and visibility trend over a 6 month period.  The Rank is specific to the keyword and search engine you have chosen. In case there are multiple landing pages for the same keyword the landing page with its specific color will be included in the graph under both Rank and Rank / Visibility tabs. The Visibility Score takes into account all tracked keywords for the campaign on the selected search engine. It will therefore differ from the Rank as it is not specific to one keyword, but rather an average score of visibility for the website.

You can also view this in a larger format in the Visibility Graph (using Tags to target a group of keywords), and create Insight Graphs and Widgets if you'd like to add it to a PDF report or dashboard as a stand-alone graph.

Dashboard Rank and Visibility Graph


Landing Page
This view provides a visual of changes in the land page that Google served for the keyword over time, and includes Rank and Visibility score.  You can gain further insights by viewing the Landing Page Monitor and Landing Page Daily Snapshot, both located in the Rank Performance reports section.
The current and previous URLs are also displayed on hover in the graph. The indicator of a yellow triangle in the table before the landing page URLs shows that there was a change in the URL. When hovering over the yellow triangle shows the Previous URL. If there was no previous URL then a - will be displayed on hover.

Dashboard Landing Page Graph

SEO Monitor
This option launches the SEO Monitor located in the Research reports section, which provides up to 20 competitors and their rank trend for the selected keyword over a 30 day period, plus detailed daily SERP snapshots.

Dashboard SEO Monitor Graph

Keyword Performance Widget

 
Keyword Performance widget provides a comprehensive overview of daily, weekly, monthly and overall Keyword Rank Change on the campaign level, along with Keyword Positions pie chart and position Gain & Loss summary for all selected Search Engines.

Weekly Rank Snapshot with Keyword Performance widget

The up and down numbers in the Keyword Change section represent the number of keywords that experienced rank change between the report end date and the previous day, week, month, and overall since the beginning of the campaign.

The Gain & Loss section is similar in that it includes data for the selected search engines, it provides the total number of keywords that had rank change from/to positions 1, 2, 3, and the Top 10 since the previous day.

These metrics include all of the selected search engines (refer to the Report Options > Search Engines to view or change the number of search engines in the report), for example, if the campaign is tracking 100 keywords on 2 search engines, then it is possible to see up to 200 position changes in the Daily section.

Report Options

 
Select Date

Date:

  • Click the calendar icon to select the date
Select Rank Tracker Dashboard General Settings

Display:

  • Custom Report Title: (optional) enter a Title to display centered at the top of your report. This title will also display on your White Label PDF Reports; both in the bookmarked links and at the top of the report.

Display General Columns:

  • Search Engine identifier: displays a search engine icon per row in addition to the search engine name at the top of the table)
  • Website (URL) per row. This must be set to display in order for SERP Feature icons, Website Tags and Brand Impact features to display.
  • Website Tags (tags added in the Campaign Settings > Websites screen to add an identifier to the URL - very useful for YouTube video URLs)
  • Brand Impact (assigned in Campaign Settings > Websites screen to associate positive, neutral, or negative color highlights to a URL)
  • Keyword Tags: displays a column containing tags per keyword. To display only keywords associated with specific tags, use the Keyword Tag filter.
  • Landing Page: displays the URL of the page that the keyword ranked highest for
  • Landing Page Tag: displays the tag entered in the Campaign Settings > Landing Pages screen for the associated URL. This is very useful for creating reports of YouTube videos with friendly tags instead or in addition to the video URL (learn more).
  • Targeted URL: displays an indicator of a match with the Target URL(s) set in the Keywords screen for individual keywords
  • Algorithm Updates: displays Google algorithm changes that have occurred during the report period, in the individual keyword performance graphs.
Display Rank Columns

Display Rank Columns:


  • Baseline: displays a column with the rank on the 1st day the keyword was added to the campaign, or if the keyword did not rank within the maximum supported results tracked by each search engine, then Baseline displays 100 on the days when the keyword ranks.
    Refer to our current list of supported search engines for rank depth and additional information
  • Best Rank: displays the highest rank recorded on any day since the campaign was created
  • Target Rank: displays a column in which target rank can be added by clicking into the cell per keyword
  • Daily rank change:  compared to the previous day
  • Weekly rank change:  compared to the same day for the previous week
  • Monthly rank change: compared to 30 days prior to the report date
  • Quarterly rank change: compared to the same date 3 months prior
  • Semi Annual rank change: compared to the same date 6 months prior
  • Annual rank change: compared to the same date during the previous year
  • Overall Change: the overall change between the Baseline rank and the report date rank
  • Featured Snippet: displays a column with a notation of when a keyword ranks in position 1 inside of a featured snippet
  • Negative Values: when disabled, keywords with negative rank change will not display in the report

Note: When a new Campaign or new Keyword is added to Rank Ranger, if the Daily, Weekly, or Monthly column is set to display before that time period has actually elapsed, then N/A will display in those columns.

SERP

Display SERP Columns:

  • SERP Feature Icons for each Google search engine. In the General section above, the Website column must be set to display because that is where these icons can be viewed.
  • SERP Snapshot: displays a column with a clickable icon that launches a window containing the top 10 (or 20 depending upon package) search engine results and features from that actual rank tracking event
Select Keyword Metrics - AdWords, KEI, Algorithm Changes

Display Keyword Metrics Columns:

 
  • Avg. Monthly Volume: based on Keyword Planner when the keyword was added to the campaign (learn more)
  • Keyword Difficulty: Keyword Difficulty Score metric from 0-100
  • Avg. CPC: AdWords average cost per click
  • PPC Competition: from AdWords
  • Date Added: Show/Hide the date the keyword was added into the campaign
Select Domain Metrics - Google, MajesticSEO, Ahrefs, Moz

Display Domain Metrics Columns:

 
  • Majestic Indexed Pages is the domain's total number of pages indexed by Majestic
  • Majestic Domain Backlinks is the domain's total number of backlinks reported by Majestic
  • Majestic Citation Flow is a flow metric, which is weighted by the number of citations to a given URL, or Domain
  • Majestic Trust Flow is a flow metric, which is weighted by the number of clicks from a seed set of trusted sites to a given URL, or Domain.
  • Ahrefs Indexed Pages is the domain's total number of pages indexed by Ahrefs
  • Ahrefs Domain Backlinks is the domain's total number of backlinks reported by Ahrefs
  • Moz Domain Authority is a prediction of this domain's ranking potential in the search engines based on an algorithmic combination of link metrics
Social Signals

Display Social Signals Columns:


  • Facebook
  • Pinterest
For more detailed data, please refer to our Social Analytics reports.
Show or Hide Events and Notes

Notes:

  • Display or Hide Notes (Single Date)
  • Display or Hide Notes (Date Range): these are notes with a date range (formerly 'events')
  • Or click the Add Note link to create a new note
Show or Hide Events and Notes

Sort and Group

  • Sort Field: select the field you want the report to be sorted by
  • Sort Direction: select the sort direction
  • Group by Domains, Keywords, or Tags determines the content of each table
Sort Columns

Columns Order


There are a couple of ways to sort order columns:
  • By clicking on the left side of the column name and dragging it to the desired position
  • By clicking on the arrow up or down until the column  name is in the desired position
report filters

Optional Filters

  • Filter the type of Rank results to display (see next section for more details)
  • Filter the type of Rank Change to show in the report and whether you want the change compared to the previous day, week or month
  • Filter the report for a specific landing page
  • Filter Search Volume (learn more below)
  • Filter by SERP Features (learn more below)
rank filter

Optional Rank Filters

  • Filter the report to display only results ranking in the top 10, 20, 30, etc.
  • Or set a minimum and maximum rank value
    minimum and maximum rank
Search volume filter

Search Volume Filter

  • Filter the report based on search volume that is greater than, equal to, or less than a specific value
SERP Features

SERP Features

  • Display All
  • Require all selected (AND) - select if you want only results that include only all of the selected SERP Indicators (e.g., Featured Snippet AND AMP)
  • Contains at least one (OR) - select if you want to view all results that include any of the selected SERP indicators
SERP Feature icons display in the Website column of this report so be sure to set that column to display in the Display > General section
filter SERP features If you have selected to filter SERP Feature results (i.e., not Display All), then check each that you to view results for in the report.
Refer to our Visual Guide to Google SERP Features to learn more
Select Keywords

Keywords:

  • Select the Keywords you want to be included in the report (use the All or None link for quick selection)

Important: When you add keywords to a campaign you need to open Report Options and check the boxes beside the new keywords or click the Reset button to display all keywords in your report. The number of keywords currently included in your report displays directly below the report title where you'll find the words "Displaying # out of ## keywords" for your convenience.  That calculation comes from the settings you select here. 

Select Keyword Tags

Keyword Tag Filter:

  • Select the tag(s) you want to filter the report results by (optional)
  • Select a Tag Filter:
    Contains at least one (OR) - this option will include any of the selected keyword tags
    Require all selected (AND) - this option requires all of the selected keyword tags in order for the keyword data to display in the report 
Select Website Domains

Websites:

  • Choose whether or not to highlight the primary URL (campaign domain) in the report (this is the default when selecting the Competitive View of this report that groups the tables by keyword and lists all the selected domains).
  • Select the websites you want to be included in the report (use the All or None link for quick selection).
Select Search Engines

Search Engines:

  • Select the search engines you want to be included in the report
  • Use the up and down arrows to reorder the display of search engines in your report, if desired

Widgets

Classic Widgets

Select a Classic Widget to display at the top of the report

  • Keyword Performance (displays the number of keywords increase and decrease for daily, weekly monthly, and overall including all Search Engines.)
  • Analytics Overview (requires Google Analytics integration)
  • Analytics Demographics (requires Google Analytics integration)
  • Rank, Visibility & Traffic (requires Google Analytics integration)
  • Click the Apply Changes button

Save your Report Options as Report Default Settings, learn more...

Save Multiple Views of this report using Report Presets, learn more...


Video: Using the Dashboard


Adding Keyword Tags


Options of Adding Keyword Tags
There are two ways to add keyword tags into the campaign:


Adding the keyword tags and tag groups via Rank Dashboard report has no option of deleting the tags from the same report.

How to Add Keyword Tags from Rank Dashboard Report

  1. Go to Rank Dashboard Make sure that the Keyword Tags toggle is ON in the Report Options > Display > General
  2. Hover over the Tags column in the report table and click the + (plus) icon
  3. Start filling out the keyword tag. A list of available tags will display from the existing tags
  4. Select a Tag Group if required from the dropdown list of existing options
  5. Click Add

YouTube Landing Page Tags

Landing Page Tags for YouTube Reporting


User-friendly YouTube Video Labels
In the Campaign Settings > Landing Pages screen to display a user-friendly description of YouTube videos in the Rank Dashboard report:
  • URL Address: enter the full URL, e.g., https://www.youtube.com/watch?v=vRgYMzahgcQ
  • Enter Tag: enter a Tag / Friendly Name as you want it displayed in the report

YouTube Landing Page Tags


Rank Dashboard Example
The settings in the Landing Page Tags above are reflected in this Rank Dashboard example
The Landing Page Tag option is located in the Report Options > Display > General section of the Dashboard report 

YouTube Dashboard with landing page tags


Add to PDF Report


Conveniently add a report or graph with its current settings to a PDF report by hovering over the gold gear icon and selecting Add to PDF Reports

add report to PDF


Select the PDF Report that you want the report or graph added to
             
select white label report

Drag the new report or graph into the position you want it to display in the PDF and confirm that the Date settings do not conflict with the automated scheduling settings.

Add to Marketing Dashboard


Conveniently add a report or graph with its current settings to a marketing dashboard:

1. Hover over the gold gear icon and select Add to Marketing Dashboard
2. Select the Dashboard (campaign name)
3. Select the Dashboard Page that you want the report added to


add report to PDF


4. Click the "Go to Dashboard" link to further customize the report (e.g., drag it to a specific position on the page, change date settings, etc.)


Refer to the Report Options section for details regarding the display settings, filters and sort options available for this report.

The report date (or date range) is governed by the selected Dashboard date option: Date Selection or Fixed Periods, learn more...

  • Daily reports default to the last day of the selected period
  • Weekly and monthly reports default to 1 month of data
To change the number of weeks or months displayed in a specific report, click the gear icon for any marketing dashboard report element and expand the Date option section, enter the number and click the Save Button.
 
marketing dashboard report date options


Add to Client Dashboard


Customize Report for Client Dashboard

Client Dashboards display our default report options for each individual report and graph until you modify them. To customize the display of the report, expand the Report Options section, change the settings and click the Apply Changes button.

Then expand Report Options again and hover over the Save icon and select Save as Default for Client Dashboard.

report options

After saving the Client Dashboard default, any changes that you make to the report options will not affect the display in the Client Dashboard unless you overwrite it by following these instructions again.


Enable the Report or Graph to display in the Client Dashboard

Open the Campaign Settings > Client Dashboard screen and check the box corresponding to the report(s) you want displayed in the dashboard, and then click the Save button. 

access permissions to client dashboard


Refer to Client Dashboard Settings documentation for additional instructions for customizing your dashboard.


Rank Data Export to Google Drive


Export Rank Tracking Report to Google Drive

To utilize the export to Google Drive feature, you must be logged into the Google account for the Drive that is connected to the campaign (learn how to authorize connection to Google Drive and connect Google Drive to a campaign).

In the Rank Tracker Dashboard report, hover over the download icon and select CSV to Drive.
 
Export Report to Google Drive


Rank Report Export Successful

The exported file displays in the browser and can be opened with a variety of tools or closed and viewed later. 

rank report exported to Google Drive


View Rank Report in Google Sheets

In the above example, I chose to open the rank report data in Google Sheets and am now able to work with that data as needed.
 
Rank Report view in Google Sheets


View Rank Ranger Campaign Data in Google Drive

After exporting a report from Rank Ranger to Google Drive, you will see a folder for each campaign in that Drive.  You can rename those folders and move them to other locations within that same Drive and Rank Ranger will continue to write to that folder when you export additional reports for that same campaign as long as authorized access exists in your Account & Campaign Settings for that Drive. These folders can be shared with others in the same manner you share any folder in Google Drive.

Rank Ranger campaign folders in Google Drive


Rank Data Files in Google Drive for 1 Campaign

In this example you see the Jeni's Splendid Ice Creams campaign with 3 files; 2 CSV files of the Dashboard report for each reflecting a different date, and 1 Google Sheet file for the date that I opened and edited the CSV file data using Google Sheets. Like all Google Drive files, these files can be shared with others and downloaded to a local computer drive.

Google Drive Files


Google Drive Error


If after clicking the CSV to Drive option, you recieve an error message from Google indicating that you need permission, that indicates that you are not logged into the Google Drive account that is connected to the campaign. You may choose one of two methods to resolve this error:
  • Click the Switch accounts button and select and log into the Google account that is connected to the campaign
  • Change the Google Drive account that is connected to the campaign in the Campaign Settings > Other Integrations screen, to the Google account that you are logged into while working in Rank Ranger.
             
Google Drive Error

Rank Values Explained


The meaning of 100+, N/A, N/R, "-" and   


The three moving dots   are an indicator that rank tracking is in progress for the keywords and you should check the report later in the day for results.  We do the best we can to complete the rank tracking as early as possible every day, however, there are some factors that are beyond our control (e.g., search engine response rate).

3 dots in a Rank Dashboard report
Rank Tracker Dashboard displaying tracking in progress for the keywords "smart home technology" and "home security".


100+ is our system default for when our rank tracker did not find the keyword ranking for the primary domain within the maximum supported results tracked by each search engine (refer to our current list of supported search engines and rank depth for additional information), and the search engine did return webpages on other domains with results for the keyword.
 
rank of 500+
Rank Tracker Dashboard displaying 100+ as the rank result for several keywords. Options exist in the Account Settings > Theme & Localization screen to set no rank within tracked results as "100+", "N/A", "NR", or "-"


example of N/AN/A means that the search engine did not return any result for the keyword, which most likely means that the keyword is not indexed by the search engine at all (e.g., the keyword "lawn mower Nome, Alaska").

N/A is also an account-wide option that can be selected in the Theme & Localization settings to represent no rank value (e.g., instead of 100+), other options include "NR", "-", or "100+". Please check your account settings before requesting assistance for a keyword that you are certain is indexed.

If you're using one of our rank reporting APIs, they return a dash "-" in the rank field when no value is available.

No Data Found


If your account is relatively new, and depending on several variables (number of keywords, number of search engines, date range, etc.), rank reports can take anywhere from a few minutes to a 8 hours until your first reports will display all of the data.  In the case of a campaign that is a day or more old, incorrect campaign configuration can lead to empty reports as well.  Clicking the Default Report Settings button usually resolves the issue.

no data found


Common causes for 'no data found' message:
  • Account is new and our rank tracker is gathering data
  • Invalid date range (e.g., the report start date is older than the campaign creation date)
  • Keyword / URL combination on report options was not found 
  • within the maximum supported results tracked by each search engine (refer to our current list of supported search engines and rank depth for additional information). Note that this is relevant only for rank reports and graphs.
  • Incomplete campaign setup (missing URL / Keywords / Search Engines / Authorized Connections)
  • Website is new and hasn't been indexed by search engines yet
  • Authorized connection to a third party data provider has expired or been configured incorrectly (refer to the third party integration or webmaster tool documentation) 
  • Delays or outage of third party data provider (e.g., Google, Facebook, Twitter, etc.)

If keywords are missing completely from a rank report, there are 2 possibilities:
  • New keywords may have been added to the campaign, but not selected. Learn more...
  • The search engine did not return any result for the keyword on any domain. In some rank reports, Rank Ranger will not display keywords for which the search engine displays no results - meaning no results for any URL on the web.  So if Google.com has results, but Google Mobile does not, you will see results for the keyword in the Google.com table, but the keyword will not display at all in the Google Mobile table. That is the way the system is designed because it needs a response from the search engine in order to record a number and when there is no response, then there is no number.

If you need assistance after reviewing and trying the options listed above, please  contact our technical support team.

Campaign Keyword Limit

There is a maximum limit of 1000 keywords per campaign in order to ensure efficient report generation and convenient viewing. Adding more than 1000 keywords to a campaign will cause some functionality to be disabled.

If you need to track more than 1000 keywords for a site, then best practice is to create additional campaigns (e.g., separate them by keyword category, location, tags, etc.).  If you have an Enterprise package, you can view rank performance data for multiple campaigns in the Portfolio Report and by using cross-campaign metrics in the Insight Graph and Single Metric Widgets.

Get the ultimate SEO tools with the Rank Ranger Software
Learn More About Rank Ranger